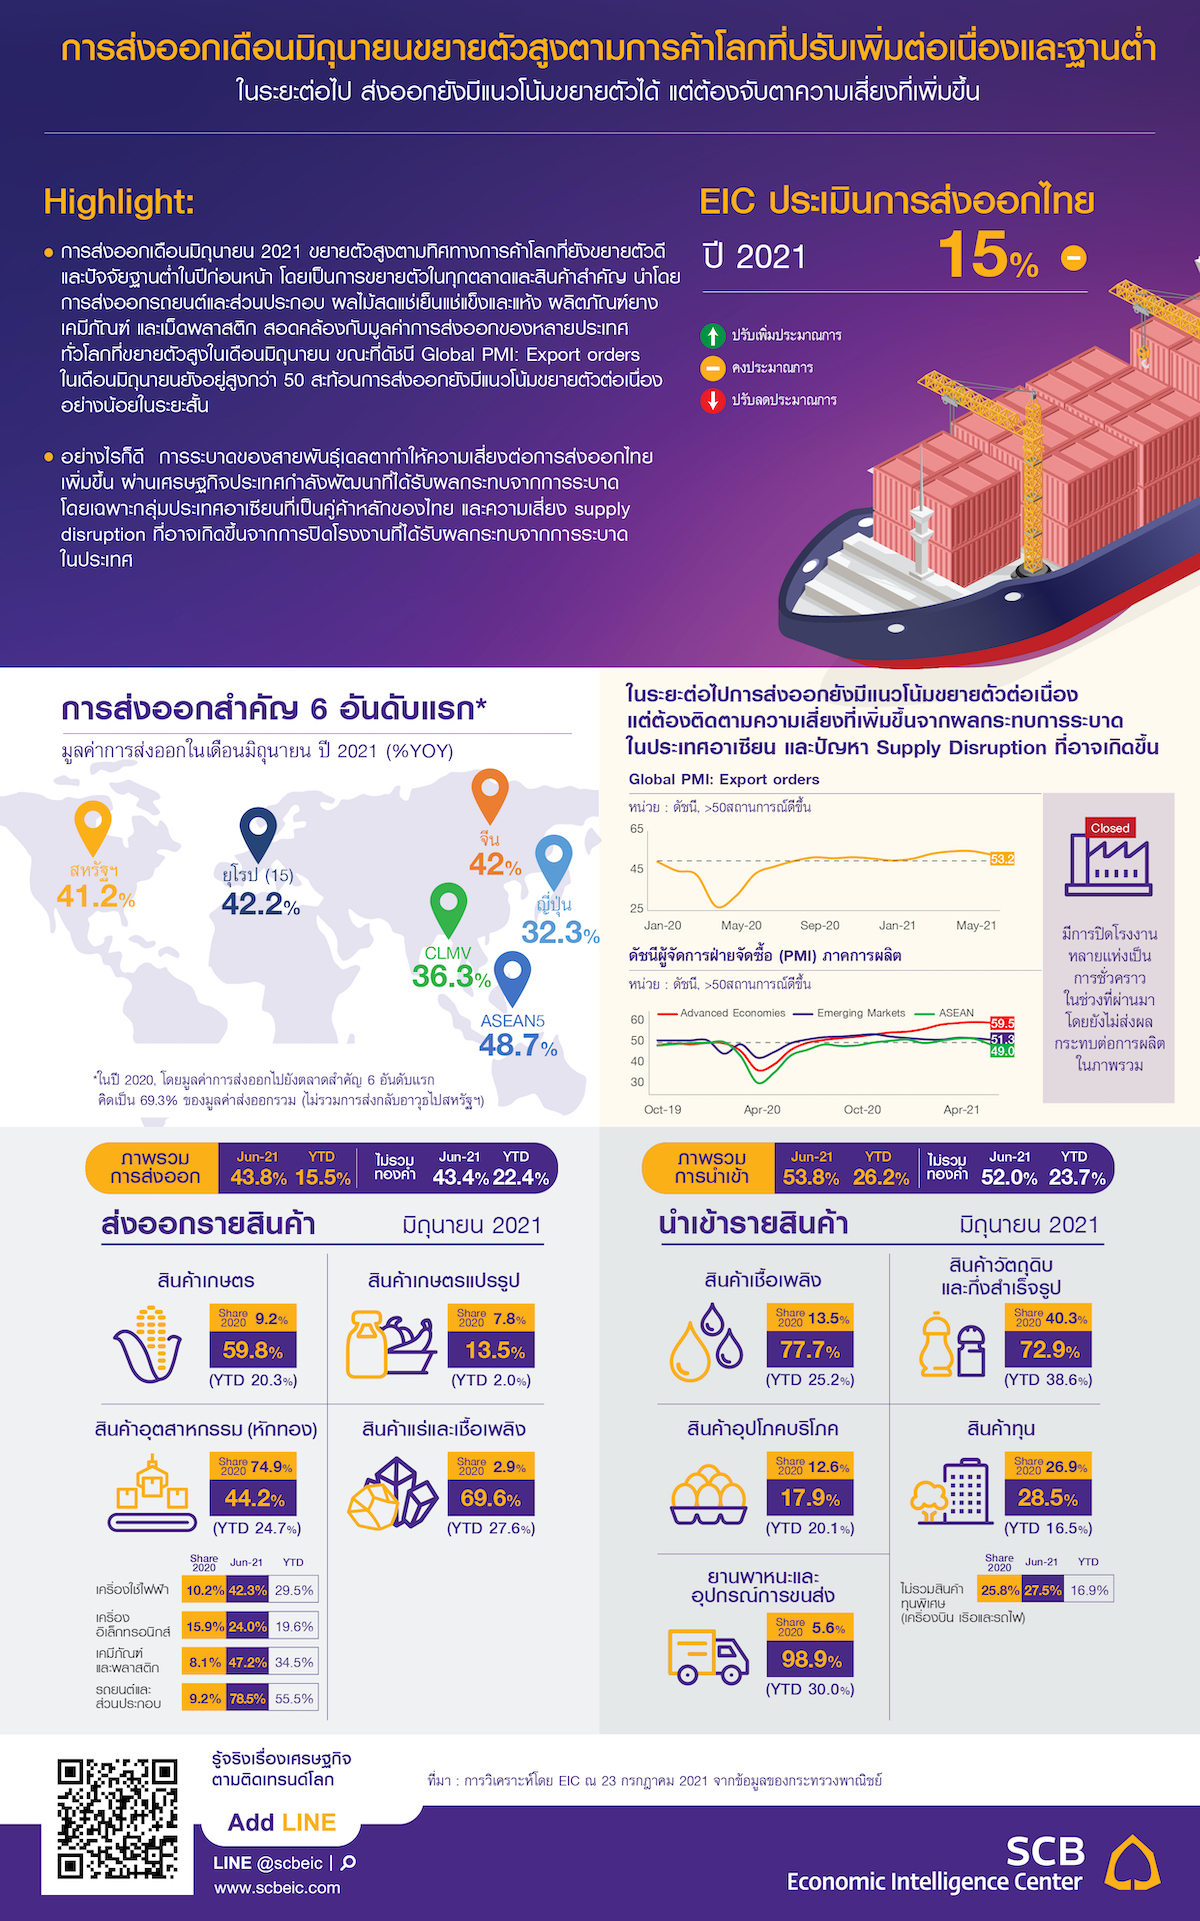
Thai Exports in June Show Significant Growth Amid Ongoing Global Trade Recovery and Low Base Effects
• In June 2021, Thai exports grew significantly, driven by a positive global trade environment and low base effects from the previous year. This growth was observed across all major markets and key products, led by exports of automobiles and components, fresh, chilled, frozen, and dried fruits, rubber products, chemicals, and plastic pellets. This aligns with the high export values reported by many countries worldwide in June, while the Global PMI: Export Orders index remained above 50, indicating continued growth in exports at least in the short term.
• However, the outbreak of the Delta variant has increased risks for Thai exports, particularly through the economies of developing countries affected by the pandemic, especially in ASEAN nations, which are key trading partners for Thailand. There are also concerns about potential supply disruptions due to factory closures resulting from the outbreak.
In June 2021, the value of exports grew by 43.8% year-on-year, marking the highest growth rate in 11 years. Excluding gold, exports would have expanded by 43.4% year-on-year, resulting in a 15.5% year-on-year growth in export value for the first half of 2021, and a 22.4% year-on-year growth when excluding gold.
Regarding exports by product category, all major types of goods saw growth, with significant increases in the following categories: automobiles and components (78.5% year-on-year), fresh, chilled, frozen, and dried fruits (185.1% year-on-year), rubber products (38.1% year-on-year), chemicals (59.8% year-on-year), and plastic pellets (50% year-on-year).
• Exports of automobiles and components grew by 78.5% year-on-year, continuing for eight consecutive months, with significant growth in key markets such as Vietnam (338.4% year-on-year), Australia (70.3% year-on-year), the United States (154.1% year-on-year), and Malaysia (305.3% year-on-year).
• Fresh, chilled, frozen, and dried fruits saw a remarkable growth of 185.1% year-on-year, with China being the primary market (263.4% year-on-year), accounting for 83.24% of total fruit exports.
• Rubber products expanded by 38.1% year-on-year, continuing for 13 months, driven by growth in related industries, including vehicle tires (50.4% year-on-year) and rubber gloves (62.2% year-on-year).
• Chemical exports grew by 59.8% year-on-year, with significant growth in markets such as China (54.3% year-on-year), Vietnam (50.2% year-on-year), and Japan (106% year-on-year). Plastic pellet exports also performed well, growing by 50% year-on-year, particularly in India (196.1% year-on-year), the United States (130.5% year-on-year), Indonesia (106.6% year-on-year), and Vietnam (74.03% year-on-year).
• Machinery and components grew by 73.1% year-on-year, continuing for the fifth consecutive month, with key markets including the United States (144.2% year-on-year), Japan (56.4% year-on-year), China (81.2% year-on-year), Indonesia (165.4% year-on-year), and Malaysia (103.6% year-on-year).
• Computer and equipment exports increased by 21.6% year-on-year, driven by the demand for electronic goods at home during the COVID situation, continuing for the seventh consecutive month, with key markets including Hong Kong (38.9% year-on-year), the Netherlands (47.3% year-on-year), and Singapore (385.2% year-on-year).
• Refined oil exports grew by 81.9% year-on-year due to the increasing demand for energy and oil, with key markets including South Korea (1,137.3% year-on-year), the Philippines (1,177.7% year-on-year), Malaysia (199.7% year-on-year), and Cambodia (55.9% year-on-year).
• Steel and iron products expanded by 83.1% year-on-year, with significant growth in markets such as the United States (48.3% year-on-year), Japan (114.9% year-on-year), China (310% year-on-year), and India (138.3% year-on-year). In terms of market exports, growth was observed across all major markets, particularly India, the ASEAN-5, the EU-15, China, and the United States.
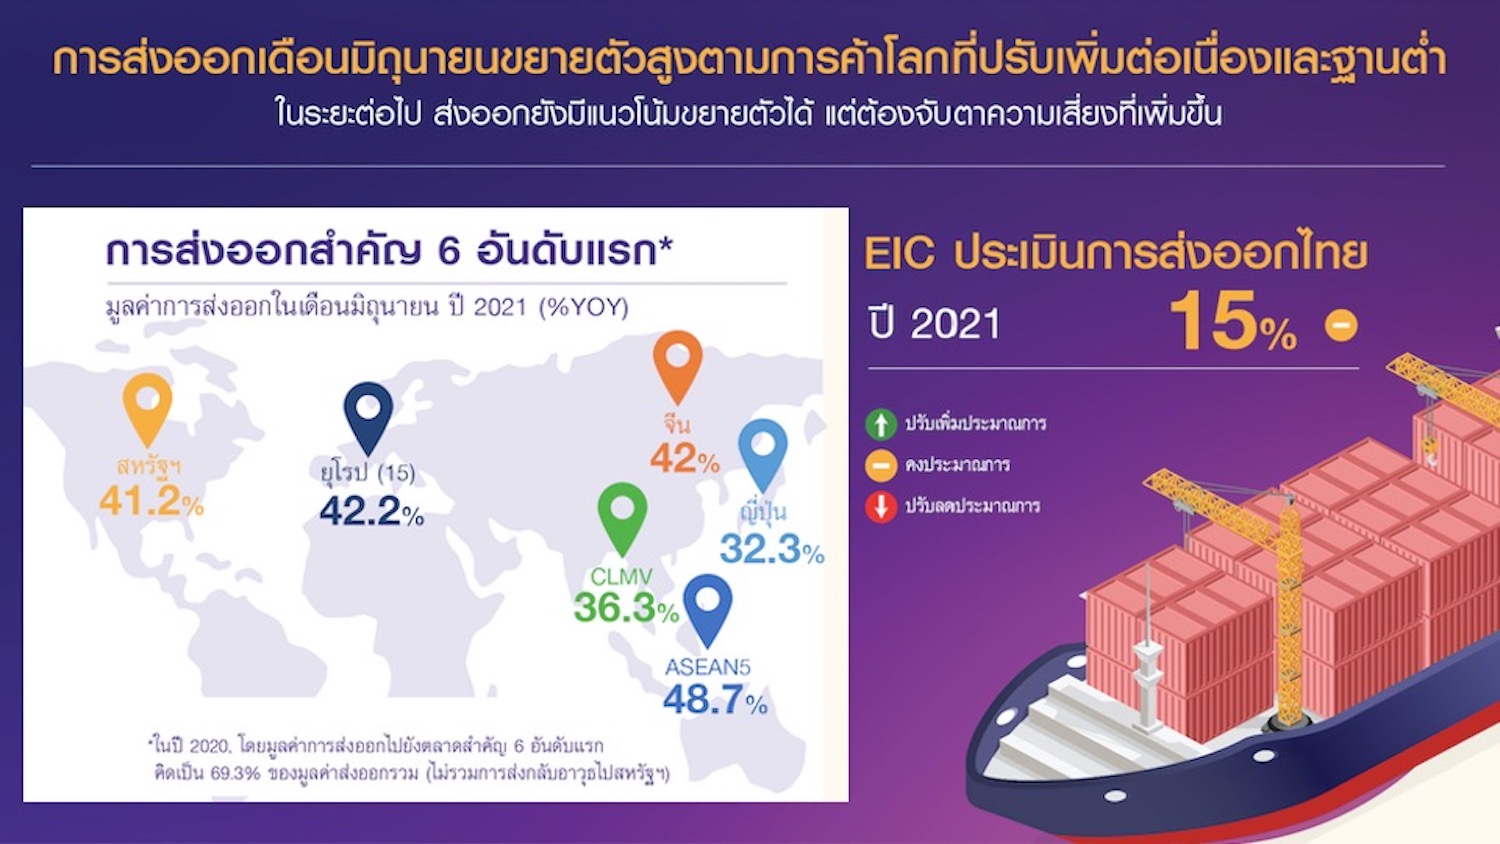
• Exports to India grew by 123.9% year-on-year, marking three consecutive months of triple-digit growth, with key products including vegetable and animal fats and oils (33,181.3% year-on-year), automobiles and components (424.6% year-on-year), steel and iron products (138.3% year-on-year), and plastic pellets (196.1% year-on-year).
• Exports to the ASEAN-5 grew by 48.7% year-on-year, with key products including automobiles and components (140.2% year-on-year), refined oil (154.4% year-on-year), and computers (82.7% year-on-year).
• Exports to the EU-15 grew by 42.2% year-on-year, marking four consecutive months of double-digit growth, with key products including gemstones and jewelry (118% year-on-year), motorcycles and components (164.8% year-on-year), and computers, equipment, and components (53.93% year-on-year).
• Exports to China grew by 42% year-on-year, marking seven consecutive months of growth, with key products including fresh, chilled, frozen, and dried fruits (263.4% year-on-year), computers and components (36.8% year-on-year), chemicals (54.29% year-on-year), and rubber (151.8% year-on-year).
• Exports to the United States grew by 41.2% year-on-year, continuing for 13 months, with key products including machinery and components (144.2% year-on-year), automobiles and components (154.1% year-on-year), gemstones and jewelry (165.7% year-on-year), and rubber products (60.2% year-on-year).
Figure 1: Exports in June 2021 Continued to Grow Across All Major Product Categories and Markets
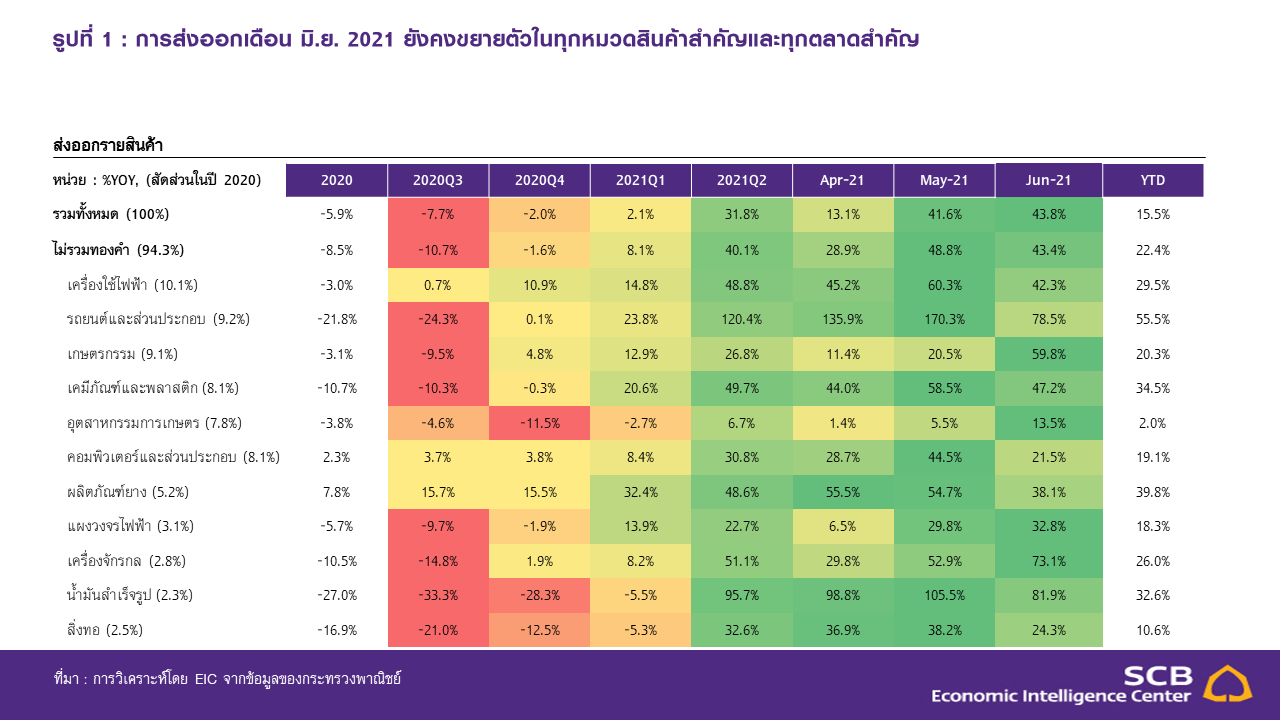
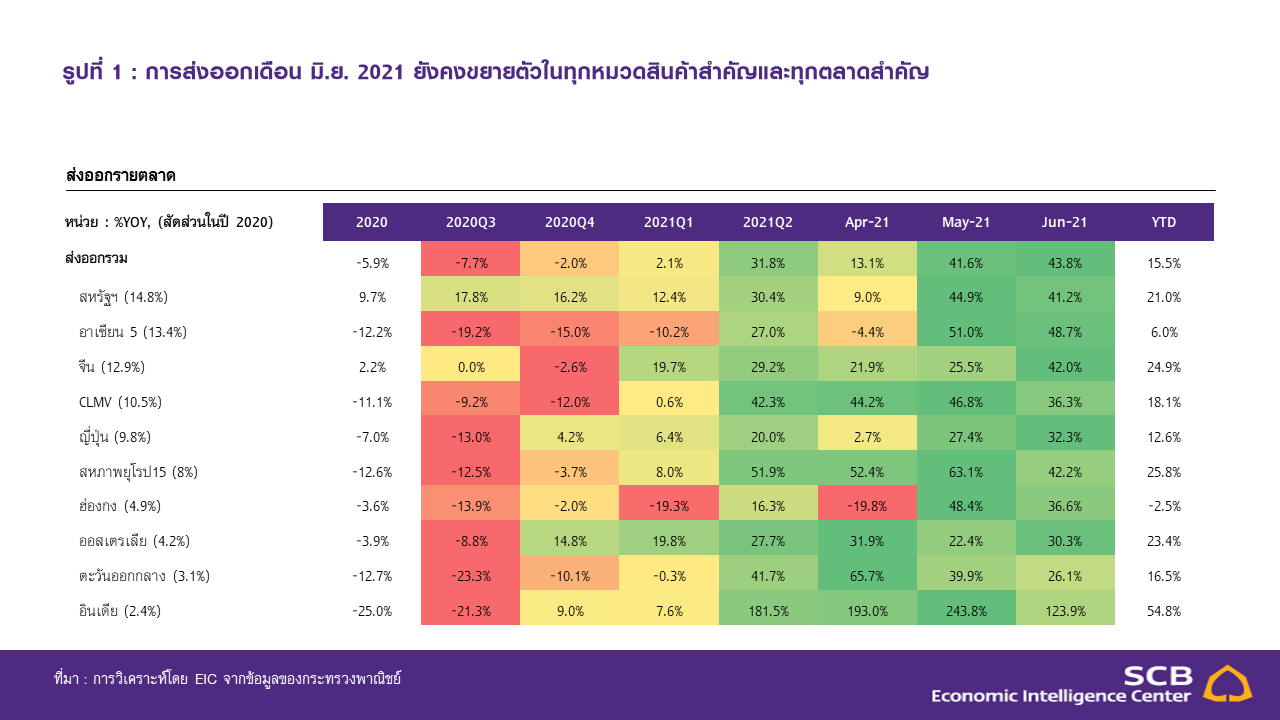
Source: Analysis by EIC from Ministry of Commerce data
Figure 2: Key Export Products Contributing Positively to Export Growth, Such as Automobiles, Fruits, Rubber Products, Chemicals, and Plastic Pellets, with No Negative Factors
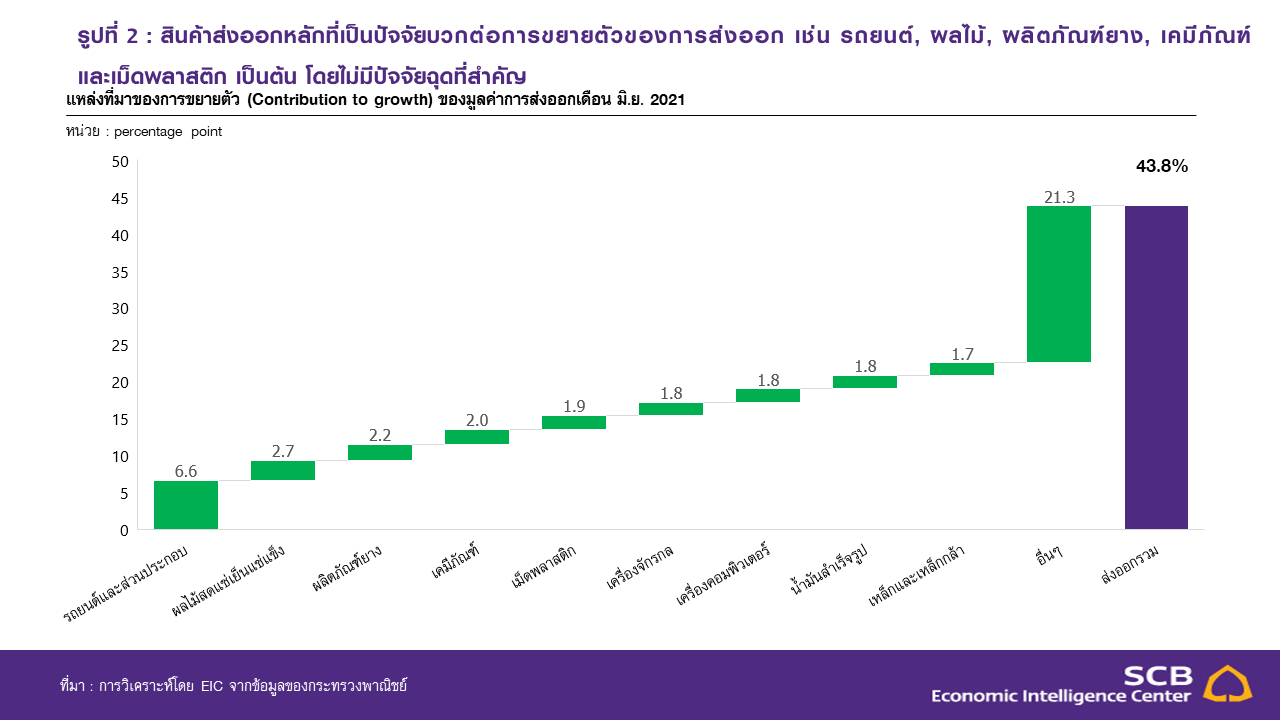
Source: Analysis by EIC from Ministry of Commerce data
In June 2021, the value of imports grew by 53.8% year-on-year, marking the fifth consecutive month of growth, consistent with the expansion in exports. This growth was observed across all major import categories, including fuel (77.7% year-on-year), driven by both low base effects and significantly increased prices compared to the previous year, capital goods (28.5% year-on-year), consumer goods (17.9% year-on-year), and vehicles and transportation equipment (98.9% year-on-year). Meanwhile, the import of raw materials and semi-finished goods also grew by 72.9% year-on-year, but when excluding gold, the growth rate would be 69.4% year-on-year. In the first half of 2021, imports grew by 26.2% year-on-year, resulting in a trade surplus of $2,439.2 million in the first half of the year.
Implication
June 2021 exports grew significantly in line with the ongoing global trade recovery and low base effects, consistent with export figures from many countries worldwide. As shown in Figure 3 on the right, in addition to low base effects, Thai exports have also increased strongly, reflected in the export value being higher than the levels of 2019, the year before the COVID-19 outbreak. When considering month-on-month growth adjusted for seasonality, Thai exports have slightly expanded by 2.4% month-on-month seasonally adjusted, following the upward trend in global trade, as reflected in the high growth rates of export values from many major exporting countries worldwide in June (Figure 3 on the left).
Figure 3: June 2021 Exports Grew Significantly Due to Low Base Effects, Consistent with Export Figures from Many Countries Worldwide
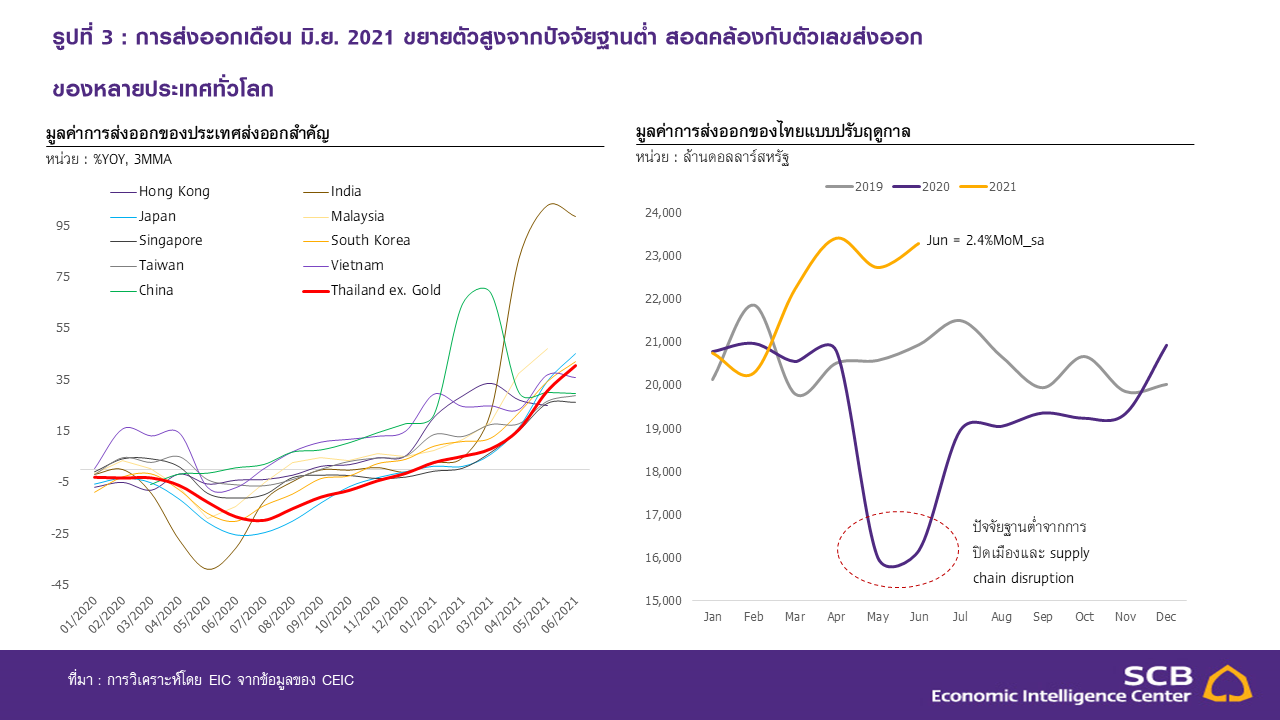
Source: Analysis by EIC from Ministry of Commerce and CEIC data
In the future, exports are expected to continue growing, but it is essential to monitor the increasing risks from the impact of outbreaks in ASEAN countries and potential supply disruptions. Despite the global spread of the Delta variant, global PMI export orders remain above 50 (Figure 4 top left), indicating that exports can continue to grow in the short term. However, the resurgence of outbreaks has had a more significant economic impact on developing countries due to slower vaccination progress, as reflected in the Manufacturing PMI of developed countries trending upward, while that of developing countries is trending downward (Figure 4 bottom left).
Thus, this is a risk that needs to be monitored, especially regarding outbreaks in ASEAN, which are crucial trading partners for Thailand, as they may affect Thai exports due to decreased demand or potential supply chain disruptions. Additionally, Thailand itself faces supply disruption risks from factory closures. According to EIC's monitoring of the situation, several factories have been temporarily closed recently (Figure 4 right), but most closures have been temporary and have not significantly impacted overall production. However, if outbreaks lead to more prolonged or widespread factory closures, it could pose a significant risk to production for exports in the future.
Figure 4: Although Exports Still Show Potential for Continued Growth, Additional Risks from Outbreak Impacts in ASEAN and Potential Supply Disruptions from Factory Closures Must Be Monitored
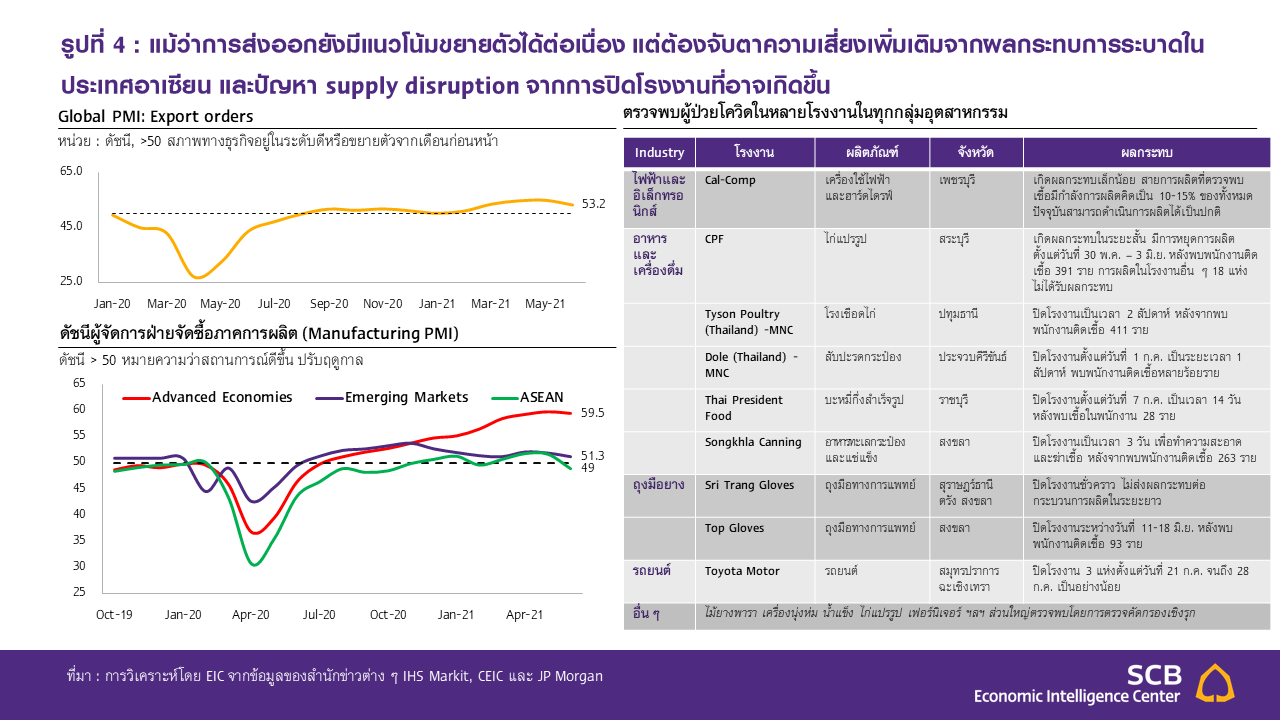
Source: Analysis by EIC from various news sources, IHS Markit CEIC, and JPMorgan
Regarding the issues of container and semiconductor (chip) shortages, these remain ongoing pressures. The container shortage worsened recently due to the impact of a new outbreak in southern China in May 2021. Although the outbreak has been controlled, it has caused delays in managing goods at the Yantian and Guangzhou ports, reflected in the continuously rising freight rates and shipping times. Additionally, the chip shortage has impacted various industries, such as mobile phones, gaming consoles, and the automotive industry. This issue will continue to be a risk factor and ongoing pressure on Thailand's export sector and the global market for the remainder of this year.
Analysis from SCBEIC >>> https://www.scbeic.com/th/detail/product/7705
Authors of the analysis:
Dr. Panundorn Aruneeniramarn ([email protected]), Senior Economist
Vishal Gulati ([email protected]), Analyst, Economic Intelligence Center (EIC)
SCB Bank Public Company Limited
EIC Online: www.scbeic.com