Housing Purchase Confidence Index in Bangkok and Surrounding Areas, Q1 2024
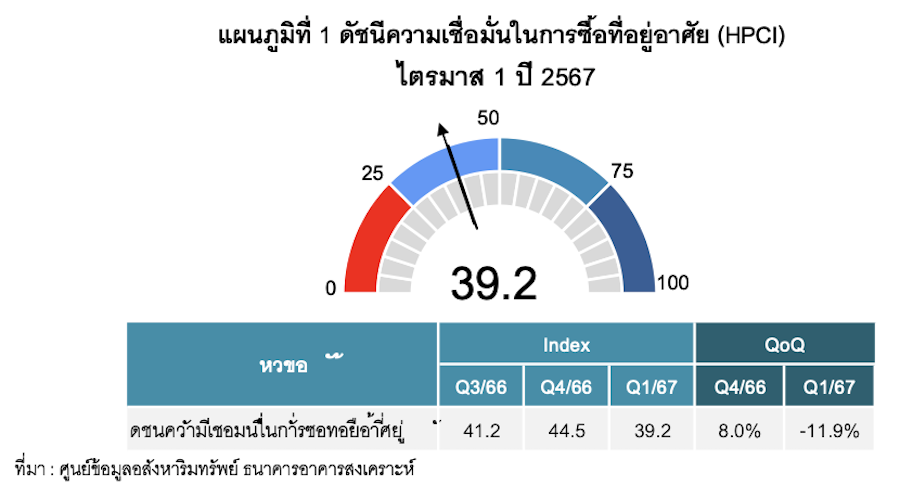
The Real Estate Information Center of the Government Housing Bank, or <\/span>REIC <\/span>has reported the housing purchase confidence index for Bangkok and its vicinity for the overall Q1 <\/span>2024 <\/span>Dr. Wichai Wiratthakhan, Inspector of the Government Housing Bank and Acting Director of the Real Estate Information Center,<\/strong> revealed that the index value stands at <\/span>39.2 <\/span>, which is a decrease compared to Q4 <\/span>2023 (QoQ) <\/span>, where the index value was <\/span>44.5 <\/span>. This reflects a confidence level below the median of <\/span>50.0<\/span>, indicating that potential homebuyers have a low level of confidence. This may be due to the Bank of Thailand gradually increasing the policy interest rate throughout <\/span>2023 <\/span>and maintaining it at a high level in this quarter, directly affecting the ability to purchase housing, along with the ongoing economic slowdown, leading to cautious spending among the public. Additionally, household debt is above <\/span>90 <\/span>%, causing potential homebuyers to lack financial readiness, resulting in concerns about applying for loans from financial institutions due to the risk of loan rejection. This aligns with the data on property transfers in the Bangkok and surrounding areas in Q1 <\/span>2024, <\/span>which saw a decrease of <\/span>24.0% <\/span>in the number of transfers and a <\/span>25.2% <\/span>decrease in value compared to the previous quarter <\/span>(QoQ). It is evident that confidence and purchasing ability for housing have significantly declined this quarter <\/span>(See Chart 1)<\/span>
 <\/p>
<\/p>
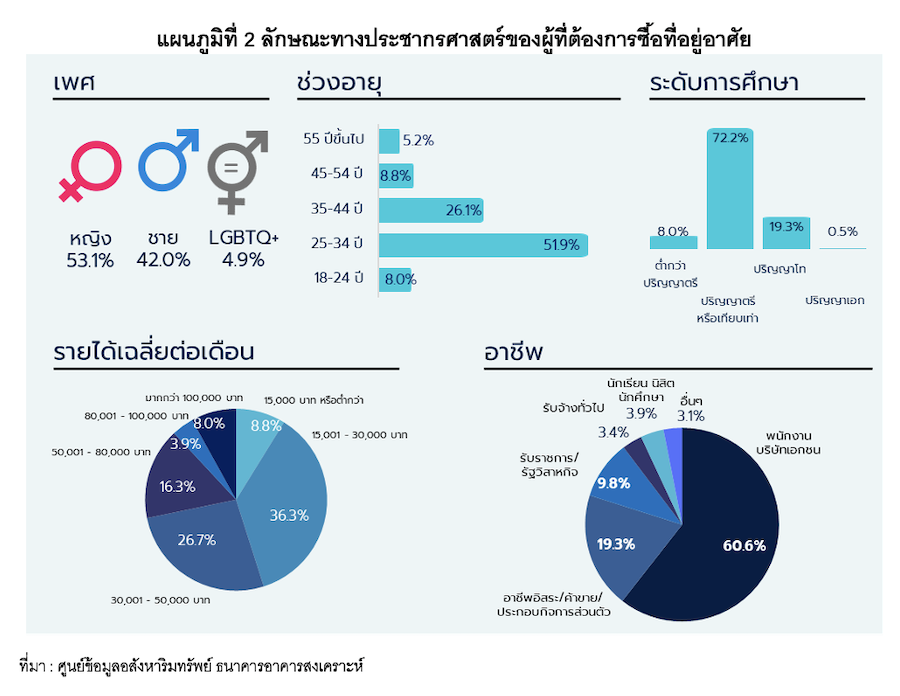
Moreover, the center has studied the demographics of survey respondents in various dimensions. Demographic Characteristics of Potential Homebuyers show that the majority are female at 53.1% and most are aged between 25-34 years, representing the Gen Y and Gen Z groups at 51.9%. Most have a bachelor's degree or equivalent, accounting for 72.2%. Additionally, 60.6% of potential homebuyers are private sector employees, and 36.3% have an average monthly income between 15,001 – 30,000 baht. Overall, the demographic characteristics are similar to the previous quarter in terms of gender, age range, education level, occupation, and average monthly income (See Chart 2).
 <\/p>
<\/p>
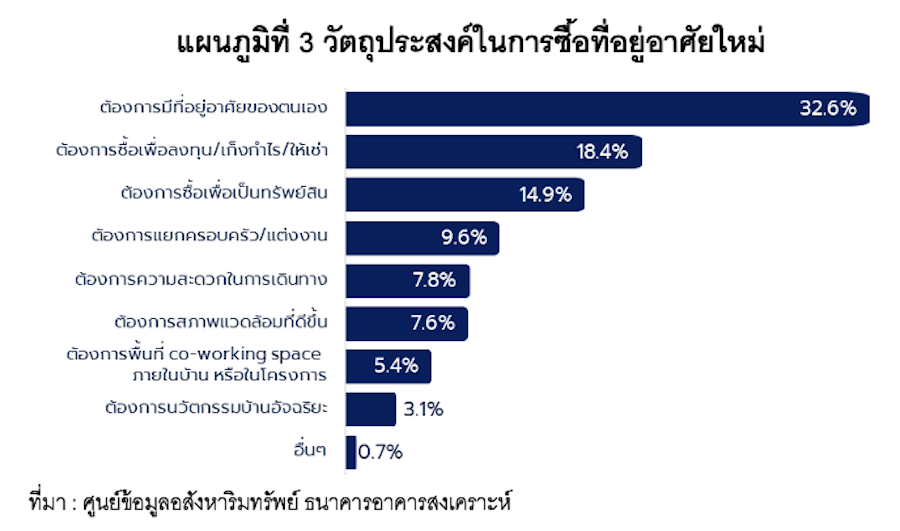
Regarding the Purpose of Purchasing New Housing, it was found that the majority of potential homebuyers, 32.6% want to own their own home. The second reason is for investment/speculation or rental at 18.4%, and the third is for asset acquisition at 14.9%. It can be seen that the purposes of buying for investment and asset acquisition together account for 33.3%, indicating that potential homebuyers prioritize investment, wealth accumulation, and life stability. Compared to Q4 2023, the factors that potential homebuyers are increasingly considering include buying for investment/speculation or rental and wanting to separate from family/marry, with proportions increasing to 18.4% and 9.6% from 12.4% and 7.5% respectively (See Chart 3).
 <\/p>
<\/p>
When considering the characteristics of housing purchase demand, it was found that:
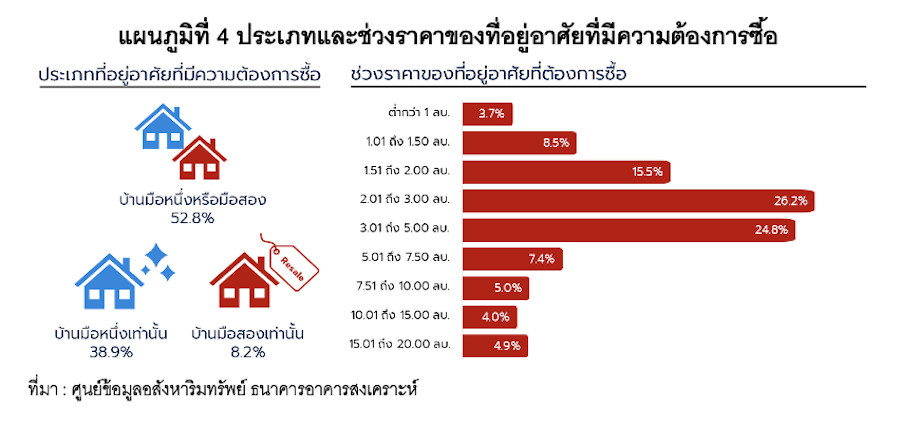
- Type of Property: The majority want to purchase both new and second-hand housing at 52.8%. When compared to Q4 2023, those wanting only new housing decreased to 38.9% from 41.5%, while those wanting only second-hand housing increased to 8.2% from 6.9%, reflecting increased interest in second-hand homes.
- Price Range of Housing: The majority want to purchase housing in the price range of 2.01 – 3.00 million baht, accounting for 26.2%. The second price range is 3.01 – 5.00 million baht, accounting for 24.8%. These two price ranges together account for 51.0%. It was also noted that the number of those wanting higher-priced housing has increased compared to Q4 2023, particularly in the price ranges of 10.01 – 15.00 million baht and 15.01 – 20.00 million baht, which increased to 4.0% and 4.9% from 1.1% and 0.3% respectively (See Chart 4).
 <\/p>
<\/p>
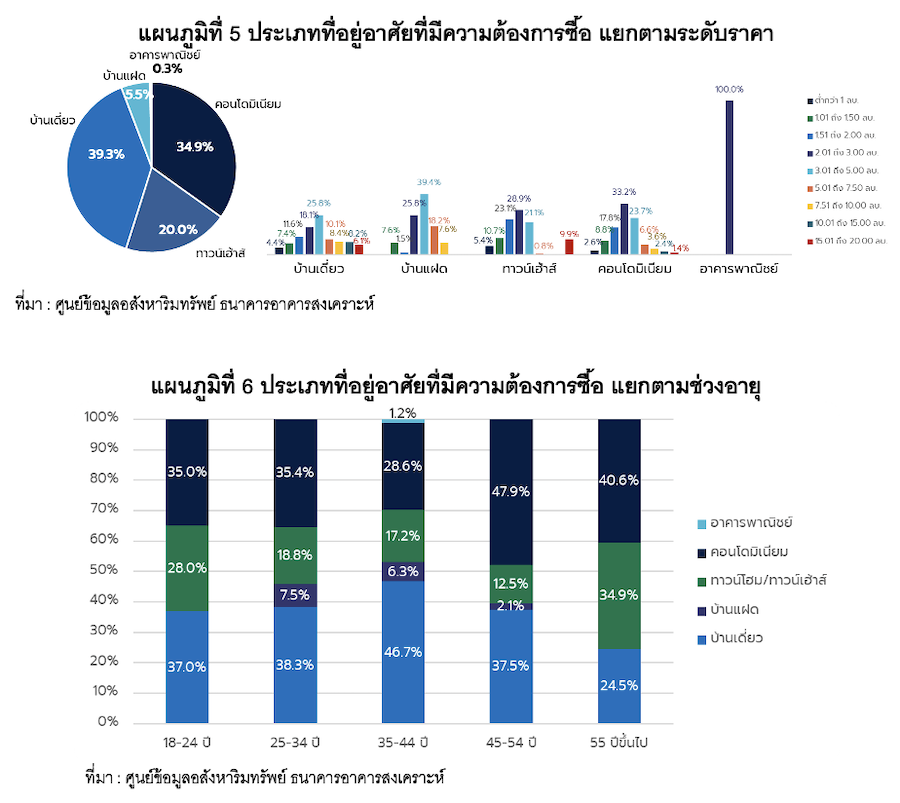
3. Type of Housing: The majority want to buy single-family homes at 39.3%, preferring the price range of 3.01 - 5.00 million baht. The second preference is condominiums at 34.9%, with the most desired price range being 2.01 - 3.00 million baht. Townhouses have a demand of 20.0%, with the majority wanting to buy in the price range of 2.01 - 3.00 million baht. Twin houses have a demand of 5.5%, with the majority wanting to buy in the price range of 3.01 - 5.00 million baht. Commercial buildings have a demand of 0.3%, with the most desired price range being 2.01 – 3.00 million baht. When considering the age of respondents, those aged 18-44 show the most interest in buying single-family homes, while those aged 45-54 and 55 and above show the most interest in purchasing condominiums, possibly due to the desire to invest and speculate since they already own housing (See Charts 5 and 6).
 <\/p>
<\/p>
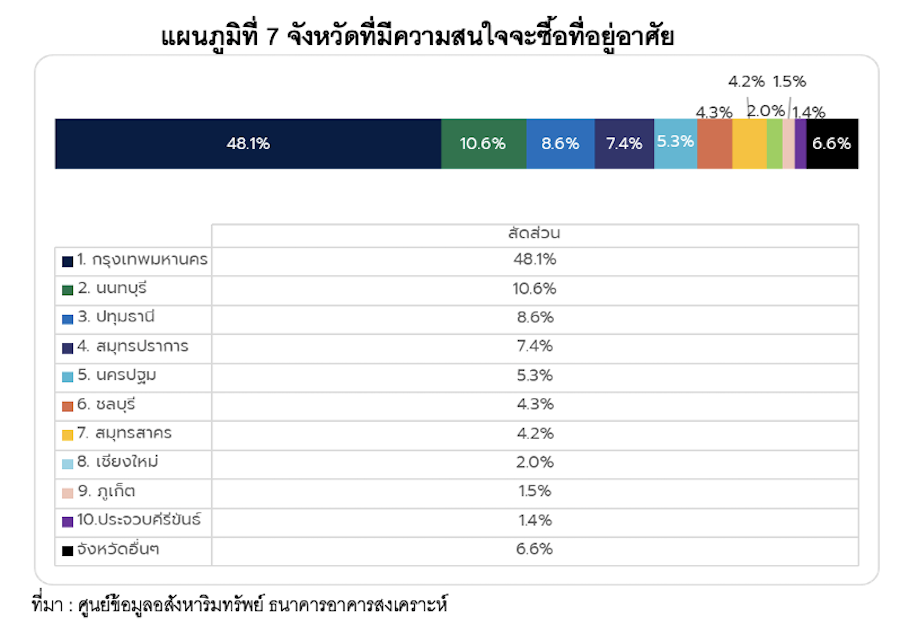
4. Provinces with Interest in Purchasing Housing: When considering the top 10 provinces with the highest interest in purchasing housing in Q1 2024, they include Bangkok, Nonthaburi, Pathum Thani, Samut Prakan, Nakhon Pathom, Chonburi, Samut Sakhon, Chiang Mai, Phuket, and Prachuap Khiri Khan. It was found that the majority have a high demand for housing in Bangkok at 48.1%, especially in locations along major subway lines, near workplaces or community areas such as Rama 9, Bangna, Bang Khae, Lat Phrao, and Huai Khwang. Provinces ranked 2-10 have proportions ranging from 1.4% to 10.6%, while other provinces have a total demand of only 6.6% (See Chart 7).
 <\/p>
<\/p>
Methodology for Data Compilation
The Real Estate Information Center of the Government Housing Bank has developed the "Housing Purchase Confidence Index for Bangkok and Surrounding Areas" by creating a quantitative index (Quantity index) in the form of a diffusion index. This was done by interviewing participants at the housing and condominium fair and those who voluntarily completed a questionnaire on the Real Estate Information Center's website, aged 18 and above, regarding their plans to purchase new housing and the timeframe they plan to buy. The steps for data compilation are as follows:
1.<\/span> Convert the questionnaire data into qualitative data with 5 levels by categorizing the responses into 5 meanings as follows:
-
- Within 1 month means having the highest confidence in purchasing housing.
- 1 to 3 months means having the highest confidence in purchasing housing.
- 3 to 6 months means having high confidence in purchasing housing.
- 6 months to 1 year means having moderate confidence in purchasing housing.
- Not exceeding 2 years means having low confidence in purchasing housing. <\/ol> <\/li>
-
- More than 2 years means having the least confidence in purchasing housing. <\/ol> <\/li>
After converting the data into qualitative data with 5 levels, convert it into quantitative data by scoring within the range of 0 to 1 as follows:
-
- Within 1 month has a confidence score of 1.00.
- 1 to 3 months has a confidence score of 1.00.
- 3 to 6 months has a confidence score of 0.75.
- 6 months to 1 year has a confidence score of 0.50.
- Not exceeding 2 years has a confidence score of 0.25.
- More than 2 years has a confidence score of 0.00. <\/ol> <\/li>
2.<\/span> The quantitative data is then calculated in the form of a Diffusion Index, which ranges from 0 to 100, using the following formula:
Index = (100 x <\/span>percentage of respondents who said "buy within 1 month and 1 to 3 months") + (75 x <\/span>percentage of respondents who said "buy within 3 to 6 months") + (50 x <\/span>percentage of respondents who said "buy within 6 months to 1 year") + (25 x <\/span>percentage of respondents who said "buy within not exceeding 2 years") + (0 x <\/span>percentage of respondents who said "buy in more than 2 years")
Interpretation
When the index median is set at 50.0, the interpretation is as follows:
Index = 50.0 means potential homebuyers have moderate or stable confidence.
Index > 50.0 means potential homebuyers have high or strong confidence.
Index < 50 means potential homebuyers have low or weak confidence.
3.<\/span> The questionnaire data is analyzed descriptively (Descriptive analytics) to gain an in-depth understanding of the housing purchase demand situation, using descriptive statistics (Descriptive statistics), frequency distribution (Frequency) as percentages (Percentage), and cross-tabulation (Crosstabs).