Fiscal Policy Office Weekly Economic Indicators Report as of September 3, 2021
Fiscal Policy Office - Weekly Economic Indicators Report as of September 3, 2021 includes the following:
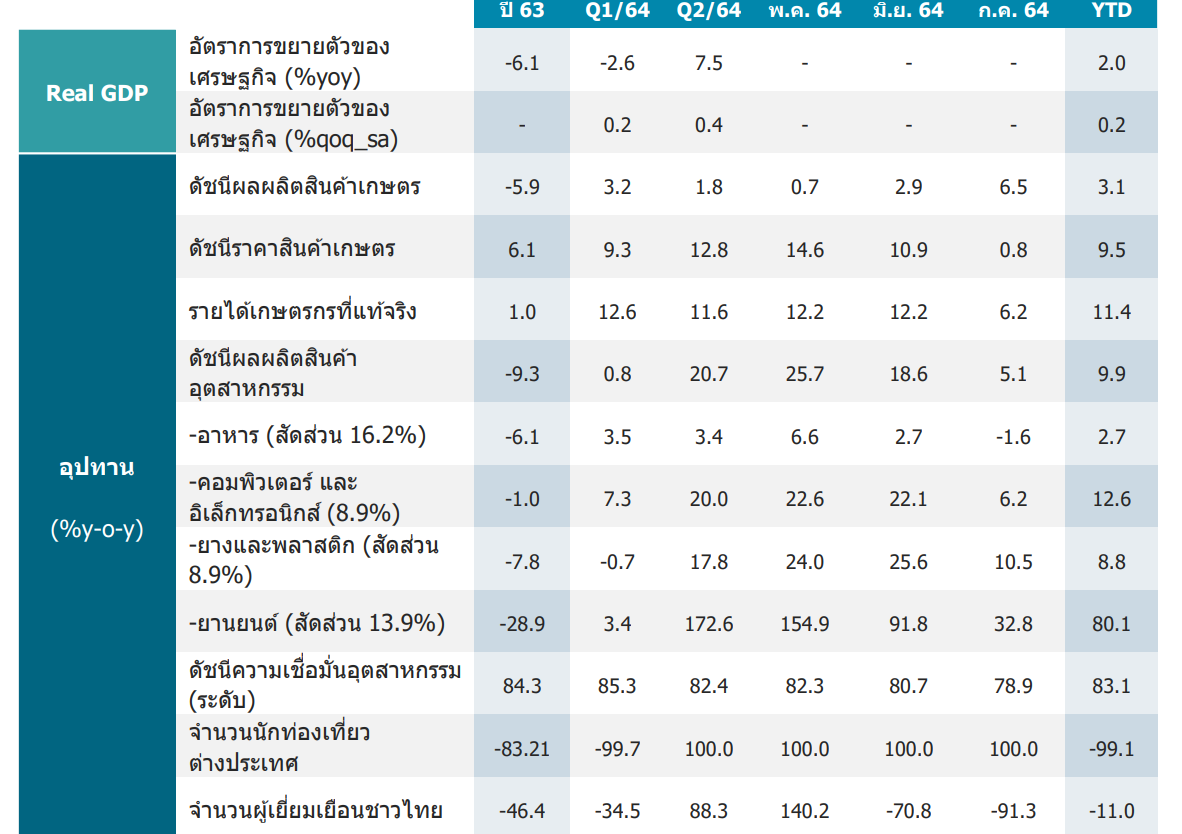
1. The Manufacturing Production Index (MPI) for July 2021 grew by 5.1% year-on-year.
2. Domestic sales of steel and steel products in July 2021 contracted by -5.6% year-on-year.
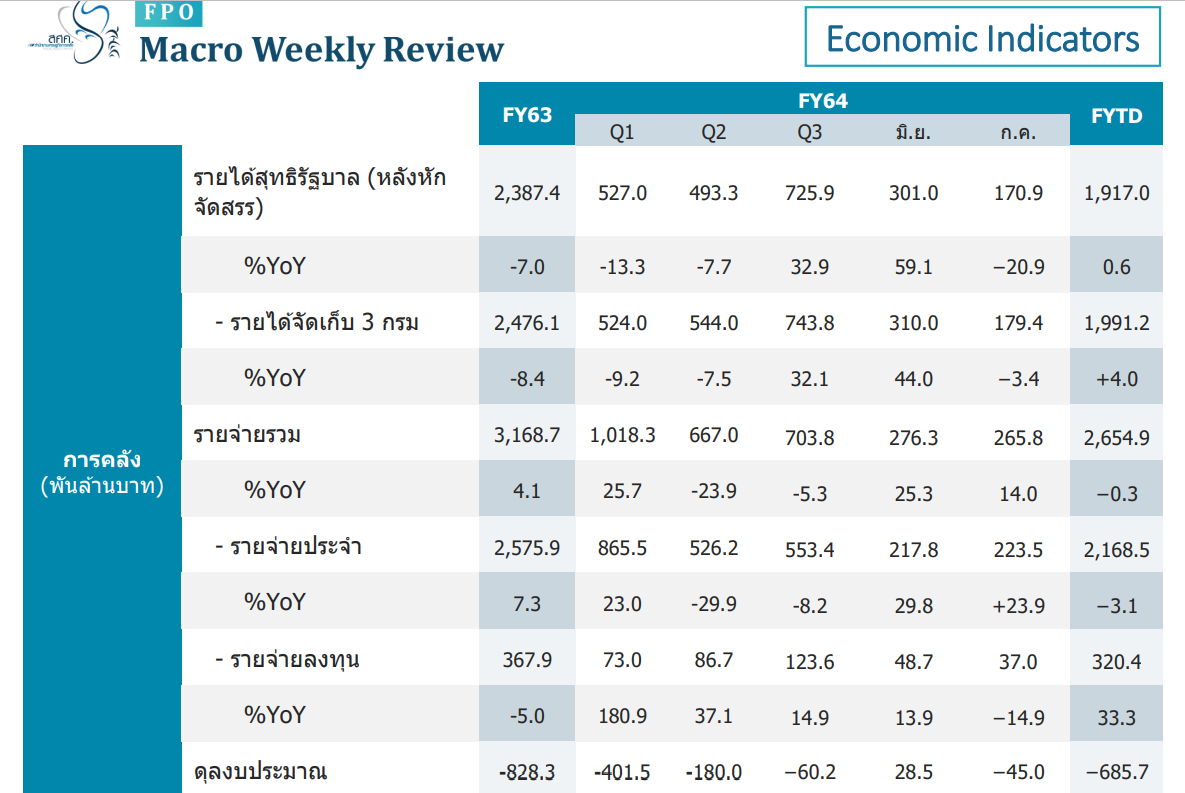
3. Total budget disbursement in July 2021 increased by 14.0% year-on-year.
4. The government's net revenue collection (after allocation to local administrations) in July 2021 decreased by -20.9% year-on-year.
5. The government's cash flow position in July 2021 recorded a deficit of -44,966 million baht.
6. Public debt outstanding at the end of July 2021 was 55.6% of GDP.
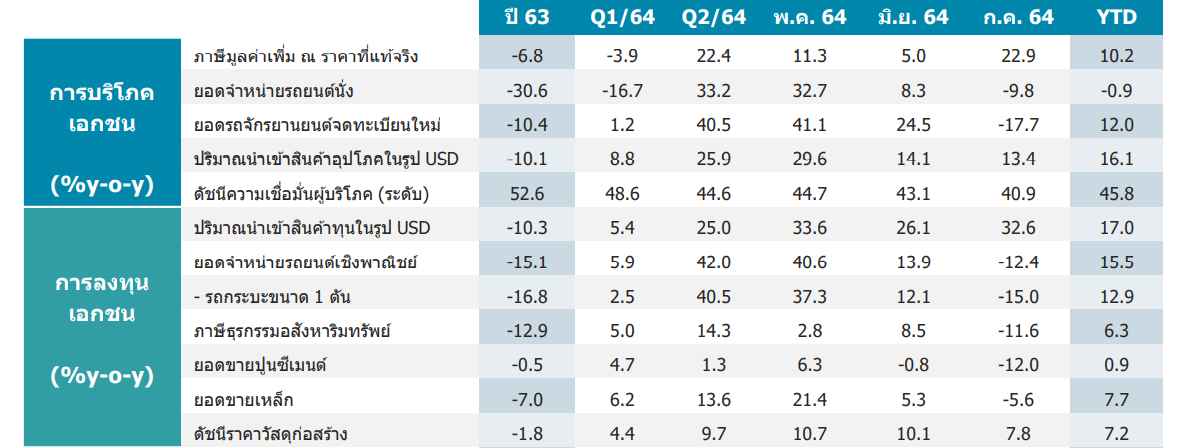
7. The value-added tax collected by the government at constant prices in July 2021 grew by 22.9% year-on-year.
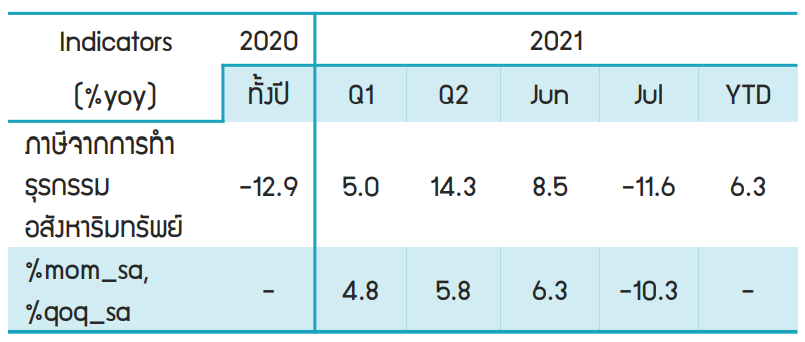
8. Taxes from real estate transactions in July 2021 contracted by -11.6% year-on-year.
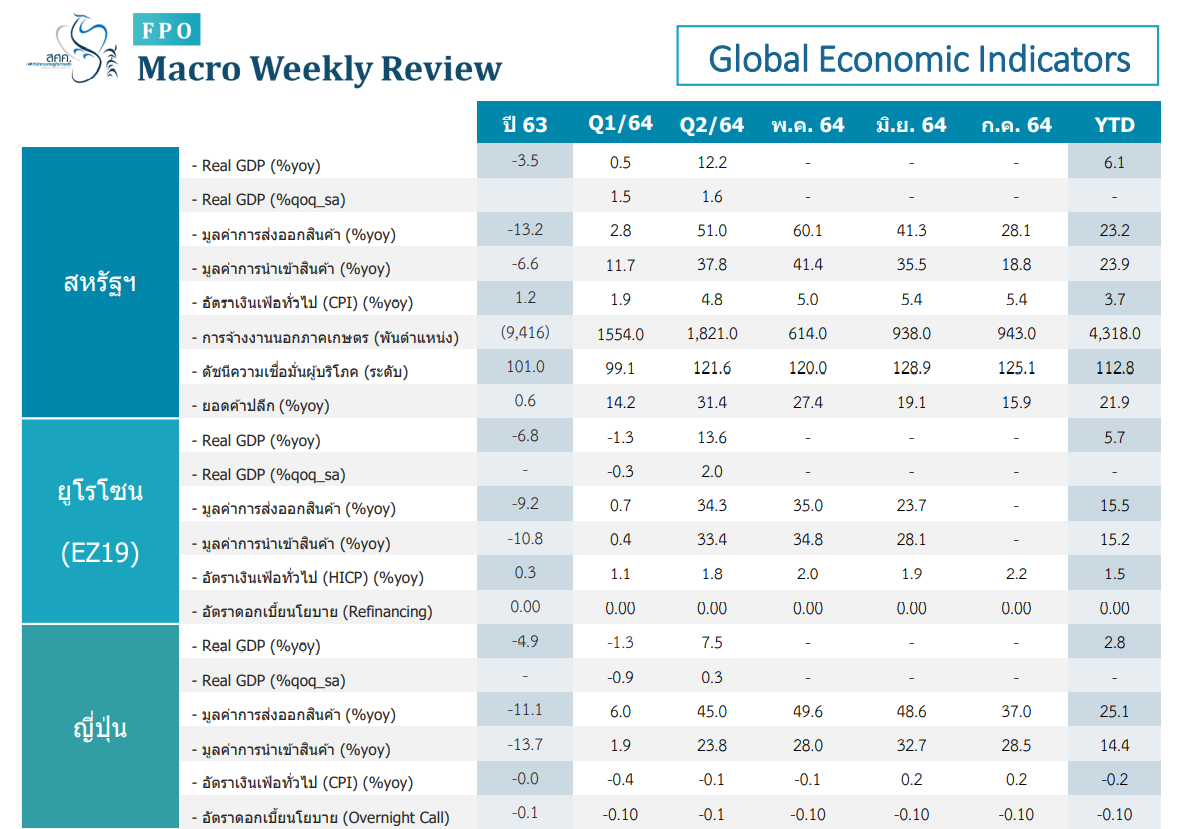
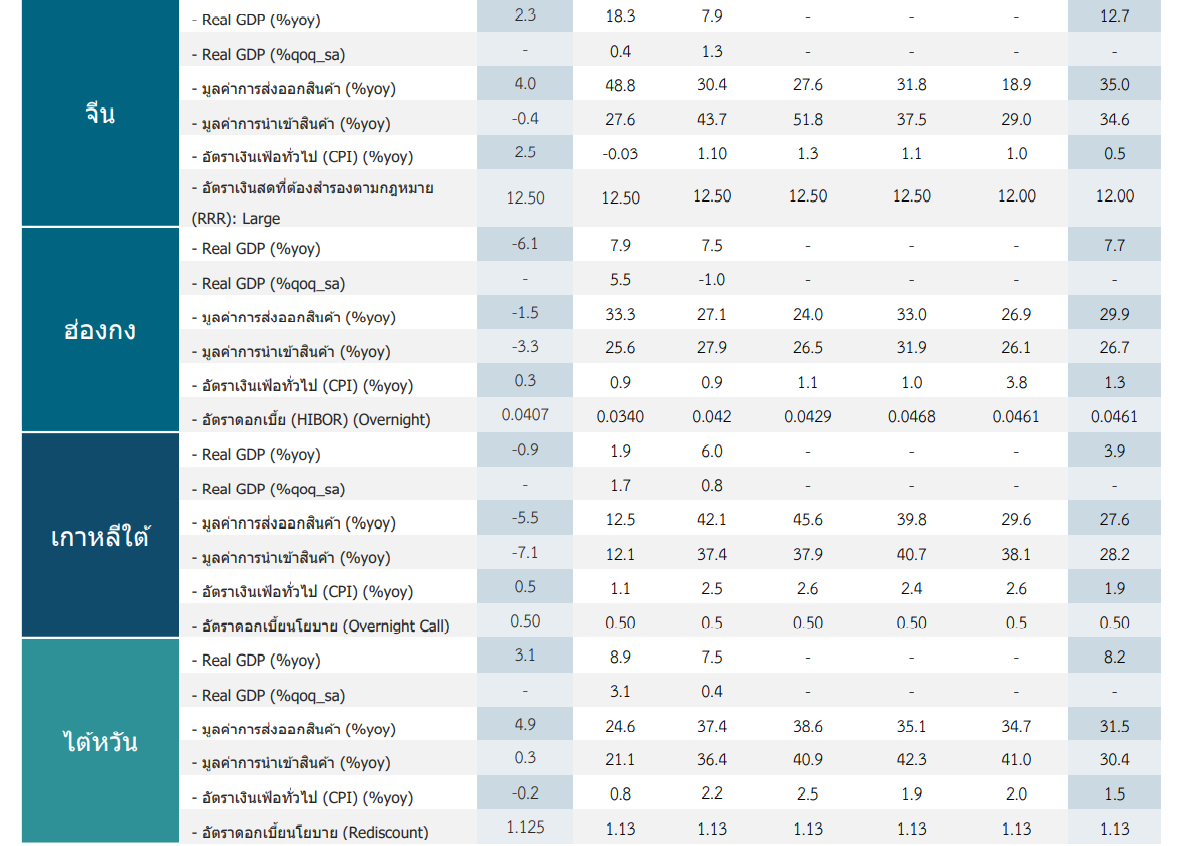
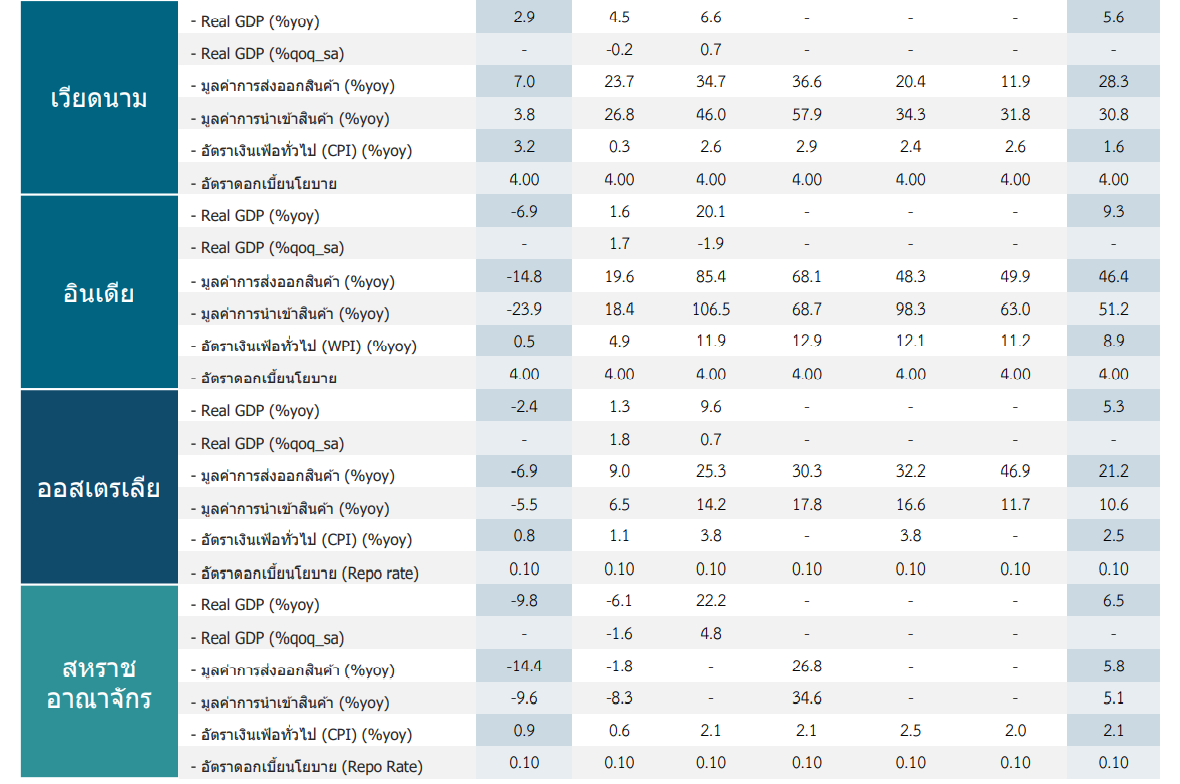
9. Australia's GDP for Q2 2021 grew by 9.6% year-on-year.
10. South Korea's GDP for Q2 2021 grew by 6.0% year-on-year.
Thai Economic Indicators
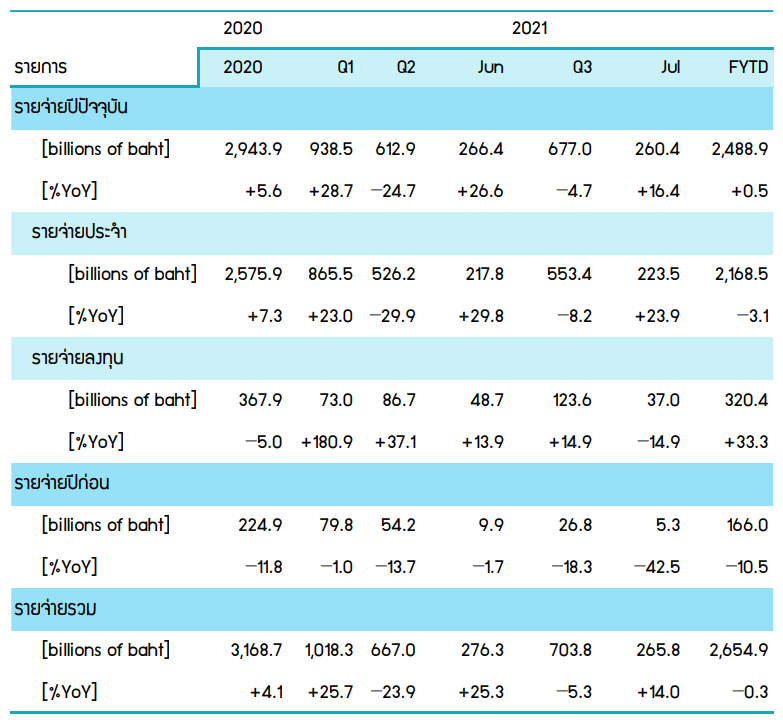
Total budget disbursement in July 2021 amounted to 265,754 million baht, an increase of 14.0% year-on-year. This brings the total disbursement for the first 10 months to 2,654,920 million baht, a contraction of -0.3%, representing a cumulative disbursement rate of 75.8%.
(1) Current year expenditures totaled 260,446 million baht, growing by 16.4% year-on-year, with a cumulative disbursement rate of 75.7%. This is broken down into:
(1.1) Regular expenditures of 223,450 million baht, growing by 23.9% year-on-year, with a cumulative disbursement rate of 82.2%.
(1.2) Investment expenditures of 36,996 million baht, contracting by -14.9% year-on-year, with a cumulative disbursement rate of 49.5%.
(2) Previous year expenditures totaled 5,308 million baht, contracting by -42.5% year-on-year, with a cumulative disbursement rate of 76.9%.
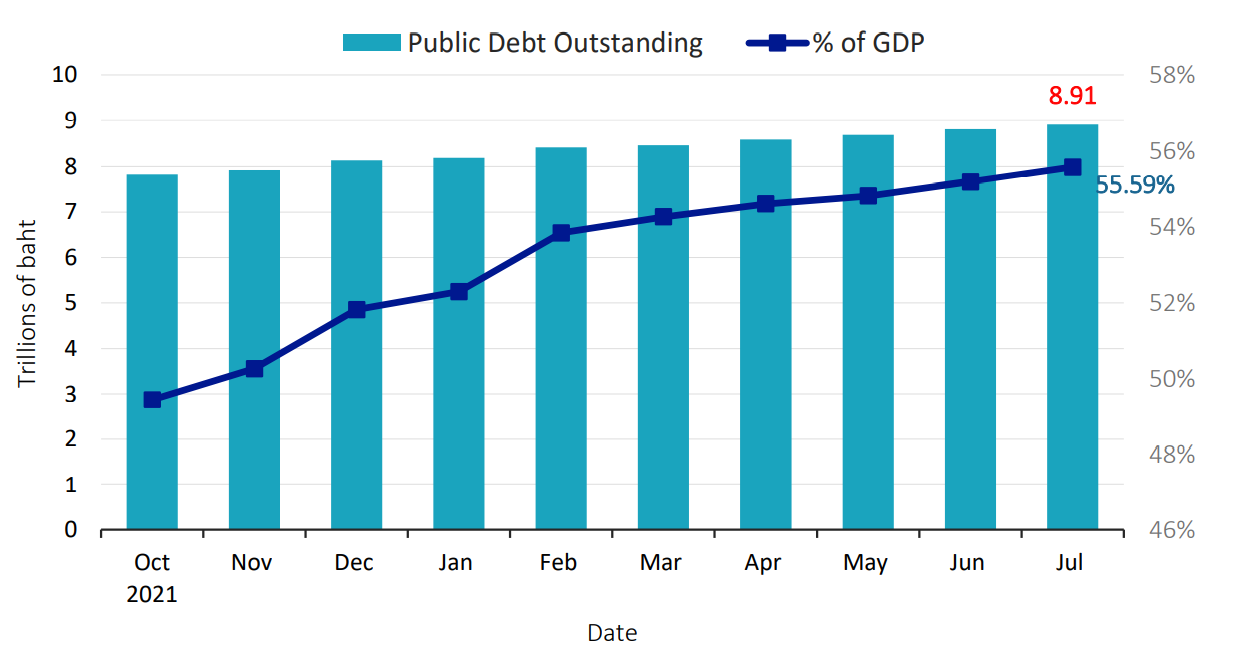
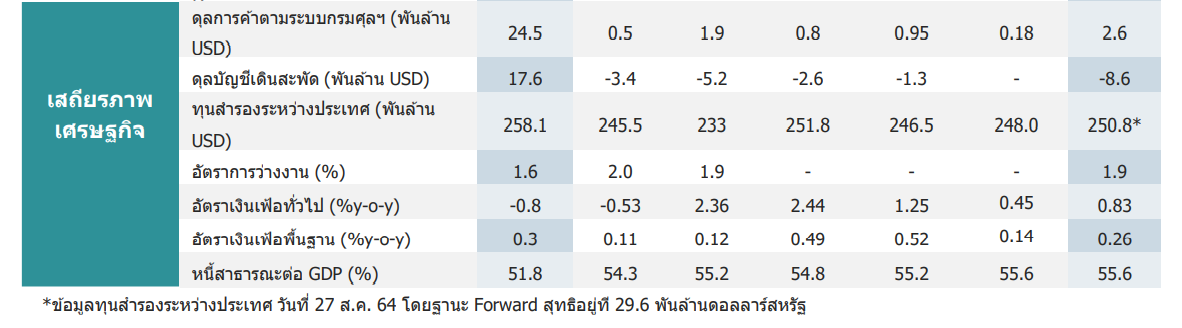
Public debt outstanding at the end of July 2021 totaled 8,909,063.78 million baht, or 55.59% of GDP. Compared to the previous month, public debt increased by a net of 83,966 million baht.
The status of Thailand's public debt is considered stable, as reflected by the public debt to GDP ratio remaining below the fiscal discipline framework set at no more than 60% of GDP. Most public debt is long-term, with 86.69% of the total public debt being long-term and 98.2% being domestic debt.
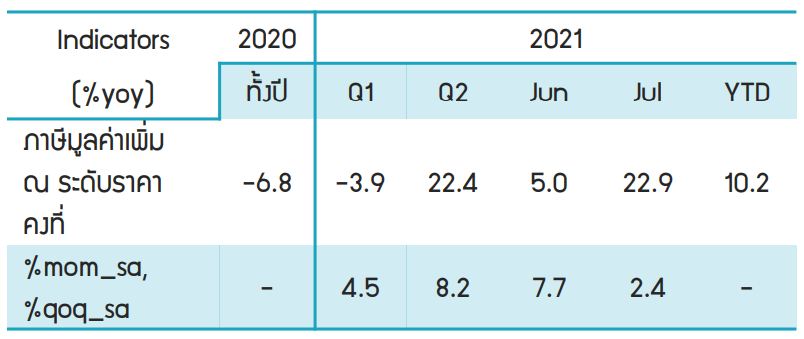
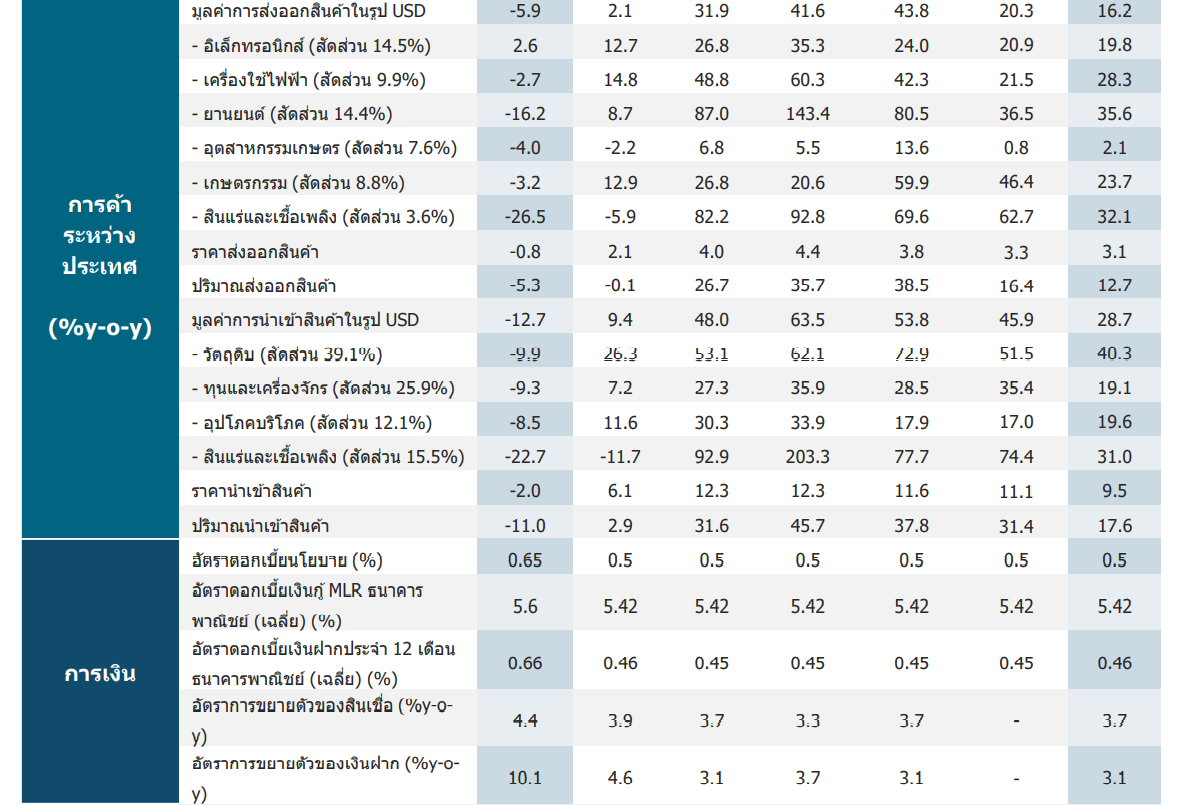
The value-added tax collected by the government at constant prices in July 2021 grew by 22.9% year-on-year. When compared to the previous month, after adjusting for seasonal effects, it grew by 2.4%.
This growth is partly due to the high growth of VAT collected from imports, which increased by 42.7% year-on-year, corresponding with the country's imports growing by 45.9% year-on-year, particularly for oil products which surged by 105.4% year-on-year. Meanwhile, VAT collected from domestic spending remained close to pre-COVID-19 levels, averaging 40,000 million baht. Additionally, in July 2021, there was a low base effect from the tax filing deadline extension, resulting in VAT collected from domestic spending growing by 11.9% year-on-year.
Taxes from real estate transactions in July 2021 contracted by -11.6% year-on-year and -10.3% compared to the previous month after seasonal adjustments.
The collection of taxes from real estate transactions in July 2021 saw a decline across all categories, particularly the specific business tax, which contracted by -8.8% year-on-year due to the impact of the third wave of COVID-19, which was severe and widespread, prompting the government to enhance control measures. This directly affected consumer confidence and purchasing power, which have decreased. It is expected that tax collection from real estate transactions will continue to slow until public confidence in the overall economy recovers.
Foreign Economic Indicators
United States
- The number of pending home sales in July 2021 decreased by -8.5% year-on-year, accelerating from -2.0% in the previous month, amid limited supply, with pending home sales declining in all regions.
- The median home price index in June 2021 grew by 1.6% from the previous month (seasonally adjusted), slowing from 1.8% in the previous month (seasonally adjusted), due to declines in the index in the Pacific West, North Central, South Atlantic, and New England regions. However, compared to the previous year, the home price index in June 2021 still showed accelerated growth from 18.8% year-on-year.
- The PMI index for the manufacturing sector in August 2021 stood at 59.9 points, up from 59.5 points in the previous month, driven by increases in new orders, production, and inventory. However, the U.S. manufacturing sector is facing challenges such as shortages of raw materials, rising product prices, and delayed shipping.
- Export value in July 2021 grew by 28.1% year-on-year, slowing from 41.3% in the previous month.
- Import value in July 2021 grew by 18.8% year-on-year, slowing from 35.5% in the previous month.
- The trade balance in July 2021 showed a deficit that narrowed from the previous month to 94.5 billion USD.
- The number of initial jobless claims for the week of August 22-28, 2021, was 340,000, down from 354,000 the previous week, marking the lowest level since March 2020, reflecting a recovery in the U.S. labor market amid the COVID-19 pandemic. However, the labor market still faces labor shortages. This level is still higher than the weekly average before the pandemic, which was around 200,000. The situation in September 2021 will be closely monitored as unemployment benefits will end and a new school term begins, which is expected to support labor market growth in the U.S.
China
- The PMI index for the manufacturing sector (NBS) in August 2021 stood at 50.1 points, down from 50.4 points in the previous month, due to the lowest factory production activity since February 2020 amid the Delta variant COVID-19 outbreak, rising raw material costs, and measures to reduce carbon dioxide emissions.
- The PMI index for the services sector (NBS) in August 2021 stood at 47.5 points, down from 53.3 points in the previous month, marking the lowest level since March 2020 due to the Delta variant COVID-19 outbreak.
- The PMI index for the manufacturing sector (Caixin) in August 2021 stood at 49.2 points, down from 50.3 points in the previous month, the lowest level since April 2020, due to lockdown measures to control the Delta variant COVID-19 outbreak, as well as supply chain disruptions and rising raw material costs.
- The PMI index for the services sector (Caixin) in August 2021 stood at 46.7 points, down from 54.9 points in the previous month amid rising COVID-19 cases in several areas.
Japan
- Retail sales in July 2021 increased by 2.4% year-on-year, up from 0.1% year-on-year, due to increased consumption.
- The unemployment rate in July 2021 decreased to 2.8% of the total labor force, down from 2.9% in June 2021.
Europe
- The PMI index for the manufacturing sector in August 2021 stood at 61.4 points, down from 62.8 points in the previous month. However, the index remains above 50 points, indicating continued expansion in the manufacturing sector.
- The unemployment rate in July 2021 stood at 7.6% of the total labor force, down from 7.8% in the previous month, marking the lowest unemployment rate since May 2020.
- The preliminary inflation rate in August 2021 grew by 3.0% year-on-year, up from 2.2% in the previous month, due to rising prices as the Eurozone economy continues to recover and low base effects.
Hong Kong
- Retail sales in July 2021 grew by 0.9% year-on-year, slowing from 2.9% in the previous month, marking the lowest level since February 2021, supported by improved domestic demand as the COVID-19 situation began to ease. It is expected that the E-voucher program of 5,000 Hong Kong dollars, which started on August 1, 2021, will help boost retail sales.
Vietnam
- The PMI index for the manufacturing sector in August 2021 stood at 40.2 points, down from 45.1 points in the previous month due to the ongoing COVID-19 outbreak that remains uncontrolled.
Singapore
- The PMI index for the manufacturing sector in August 2021 stood at 52.1 points, down from 56.7 points in the previous month.
Australia
- Australia's GDP for Q2 2021 grew by 9.6% year-on-year, or 0.7% compared to the previous quarter (seasonally adjusted). The trade balance in July 2021 showed a surplus of 12.11 billion Australian dollars, up from 11.1 billion Australian dollars in the previous month.
South Korea
- South Korea's GDP for Q2 2021 grew by 6.0% year-on-year, or 0.8% compared to the previous quarter (seasonally adjusted), marking the highest growth since Q4 2010, driven by low base effects and supported by increased exports, private consumption, and government spending.
- The inflation rate in August 2021 remained stable at 2.6% year-on-year, the highest level since August 2020.
- Industrial production in July 2021 grew by 7.9% year-on-year, slowing from 11.5% in the previous month.
- The PMI index for the manufacturing sector in August 2021 stood at 51.2 points, down from 53.0 points in the previous month amid rising COVID-19 cases and raw material shortages.
- Retail sales in July 2021 grew by 7.9% year-on-year, accelerating from 1.6% in the previous month.
- Export value in August 2021 grew by 34.9% year-on-year, accelerating from 29.6% in the previous month, driven by strong demand for chips and automobiles. Import value in August 2021 grew by 44.0% year-on-year, accelerating from 38.1% in the previous month.
- The trade balance in August 2021 showed a surplus of 1.67 billion USD, down from 1.77 billion USD in the previous month, marking the 16th consecutive month of surplus.
Malaysia
- The PMI index for the manufacturing sector in August 2021 stood at 43.4 points, up from 40.1 points in the previous month.
Indonesia
- The PMI index for the manufacturing sector in August 2021 stood at 43.7 points, up from 40.1 points in the previous month.
- The inflation rate in August 2021 was 1.6% year-on-year, up from 1.5% in the previous month, primarily due to rising prices in food, beverages, and tobacco.
Philippines
- The PMI index for the manufacturing sector in August 2021 stood at 46.4 points, down from 50.4 points in the previous month.
Taiwan
- The PMI index for the manufacturing sector in August 2021 stood at 58.5 points, down from 59.7 points in the previous month, primarily due to a slowdown in production and new orders.
Money Market and Exchange Rate Indicators
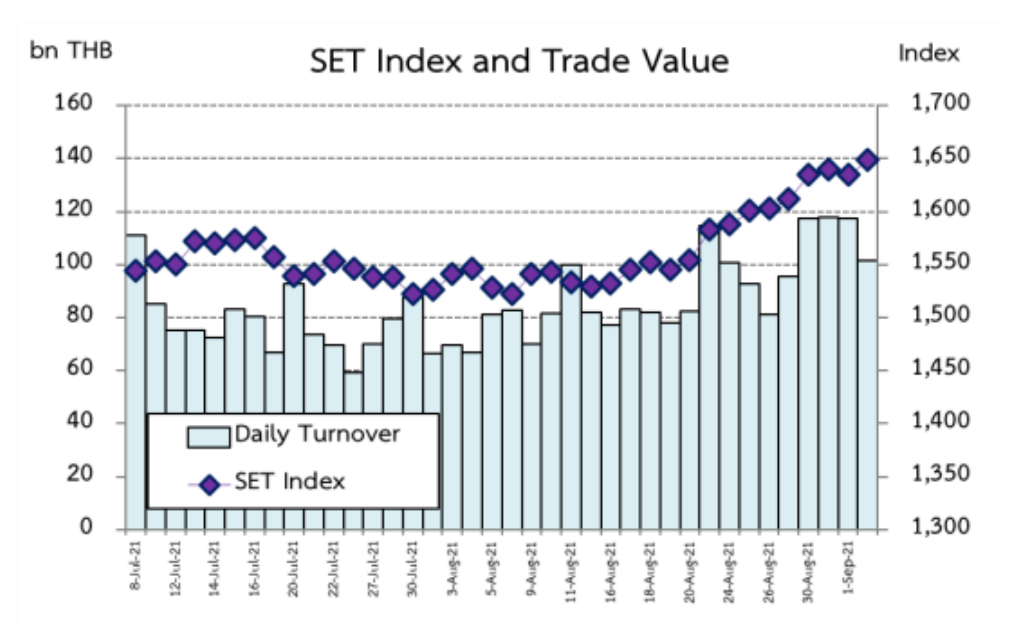
The SET index slightly increased from the previous week, in line with other regional stock markets that also rose from the previous week, such as Nikkei225 (Japan), HSI (Hong Kong), and DJIA (USA). On September 2, 2021, the index closed at 1,647.75 points, with an average trading value between August 30 and September 2, 2021, of 113,597.77 million baht per day. Foreign investors and securities company accounts were net buyers, while domestic retail investors and domestic institutional investors were net sellers. Between August 30 and September 2, 2021, foreign investors purchased a net of 8,414.51 million baht.
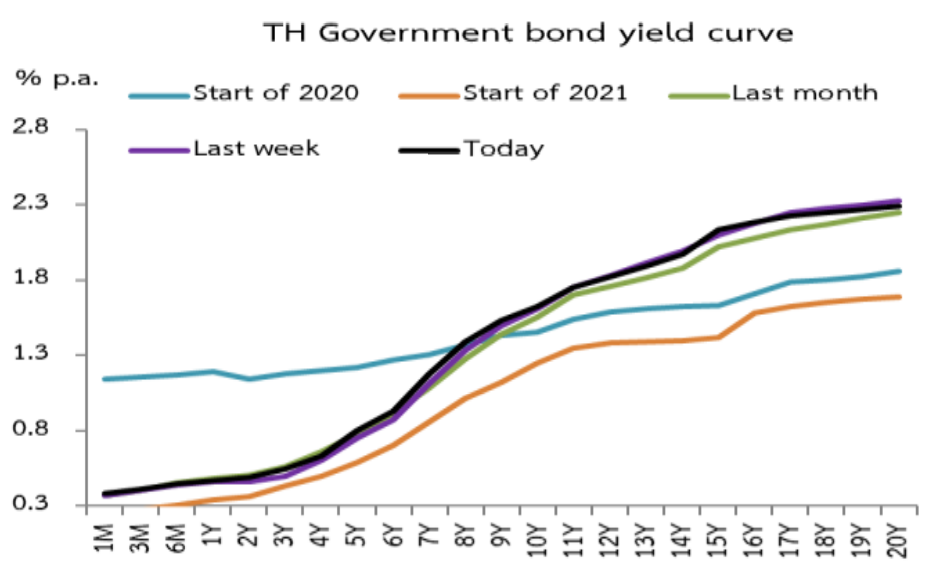
The yield on government bonds under 11 years increased by 1 to 6 basis points, while government bonds over 11 years decreased by -1 to -3 basis points. This week, investors participated in the auction of 4-year government bonds, which saw demand of 1.33 times the auction amount. Between August 30 and September 2, 2021, foreign capital flowed into the bond market, netting 19,886.28 million baht.
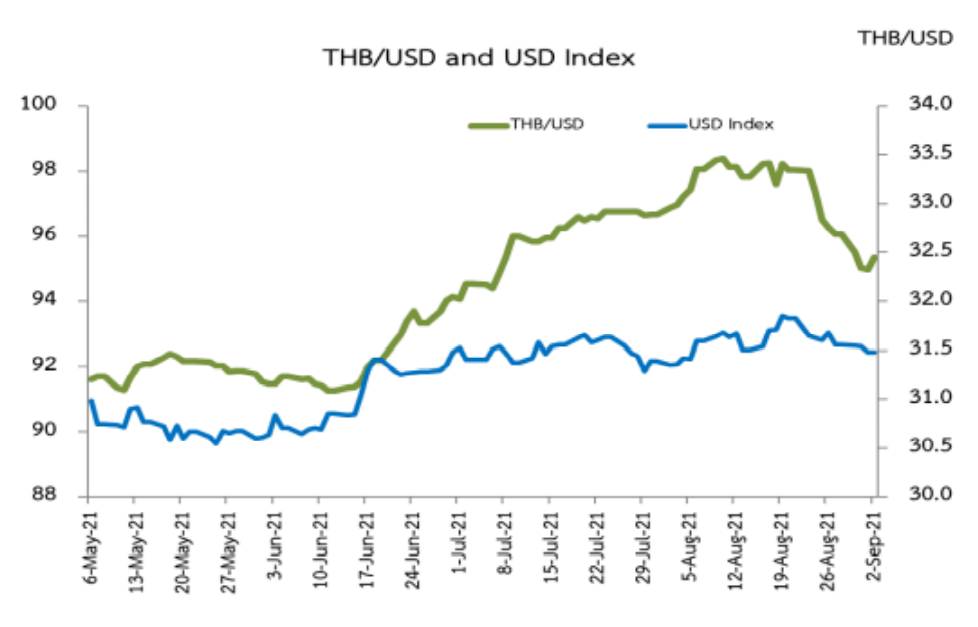
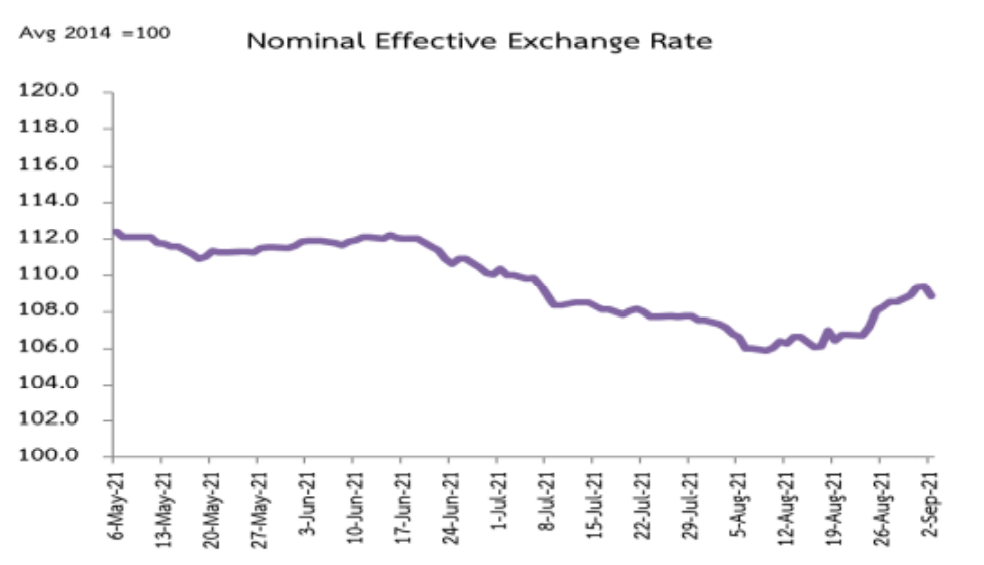
Foreign investors flowed into the bond market, netting 122,689.20 million baht, and the baht appreciated from the previous week. As of September 2, 2021, the baht closed at 32.45 baht per USD, appreciating by 0.96% from the previous week, in line with the appreciation of the yen, euro, ringgit, won, Singapore dollar, and yuan against the USD. The baht appreciated more than other major currencies in the region, resulting in the Nominal Effective Exchange Rate (NEER) appreciating by 0.53% from the previous week.
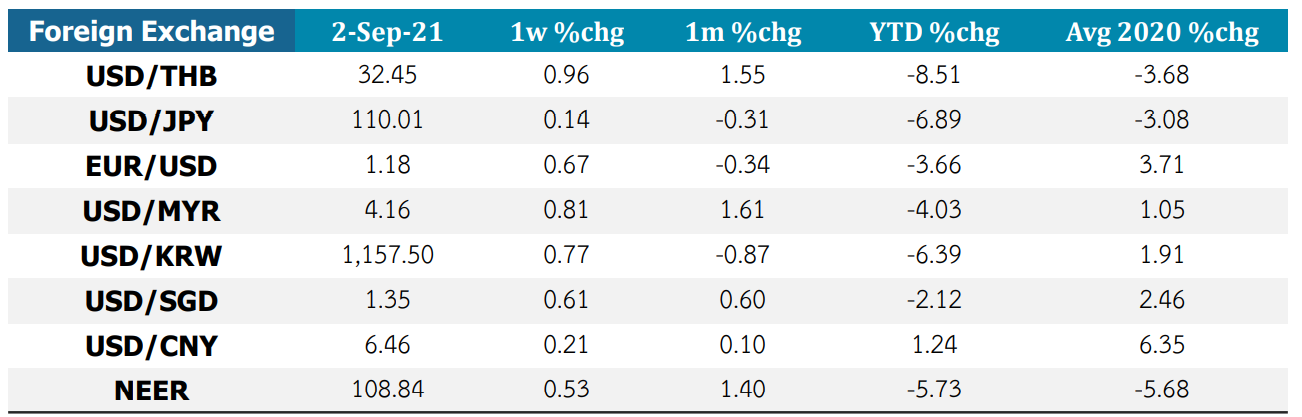
Exchange rates of various currencies: a + indicates appreciation and a - indicates depreciation against the USD.
The NEER index appreciated (+) or depreciated (-) during the specified period, expressed as a percentage.
Thank you for the information from the Macroeconomic Policy Bureau, Ministry of Finance
Macroeconomic Policy Bureau Fiscal Policy Office Ministry of Finance 02-273-9020 Ext. 3259