The Index of Vacant Land Prices Before Development in Bangkok and Surrounding Areas in Q2/2021 Increases at a Slower Rate than the 5-Year Average
The Real Estate Information Center of the Government Housing Bank reports that the index of vacant land prices before development in Bangkok and surrounding areas for Q2 2021 stands at 332.8 points, reflecting a 2.0% increase compared to the previous quarter (QoQ) and a 7.8% increase year-on-year (YoY). However, this increase is at a slower rate than the average growth rate over the past 5 years. From 2016 to 2020, the index of vacant land prices increased by an average of approximately 17.7% per quarter compared to the same period of the previous year (YoY).
Dr. Vichai Viratthakhan, Inspector of the Government Housing Bank and Acting Director of the Real Estate Information Center, stated that despite the increase in land prices, the growth rate of the index of vacant land prices before development is lower than the 5-year average growth rate. This trend has continued for three consecutive quarters since Q4 2020, coinciding with the COVID-19 pandemic, and extending into Q2 2021. It is evident that the prices of vacant land before development in Bangkok and surrounding areas are still increasing but at a slower pace. This suggests that some landowners, who have been less affected by the pandemic, may choose to hold onto their land while waiting for the economy to recover. Conversely, some landowners may have sold their land during this period, coupled with a decrease in demand for land, resulting in only a modest increase in land prices. However, in the future, if landowners seek to sell more land, it may lead to a continued slowdown in the rate of change in vacant land prices before development in Bangkok and surrounding areas.
Table 1: Index of Vacant Land Prices Before Development in Bangkok and Surrounding Areas Q2 2021
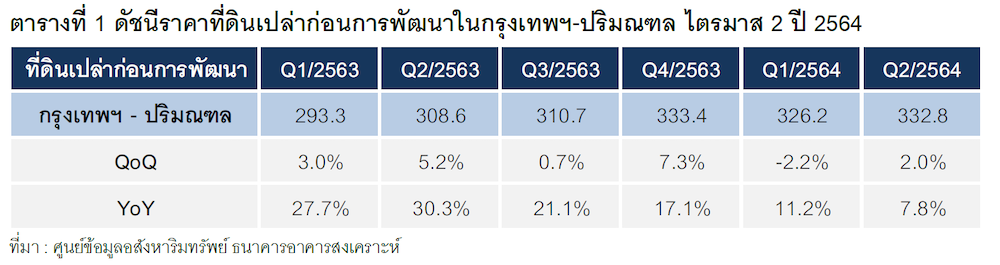
Source: Real Estate Information Center, Government Housing Bank
Chart 1: Index of Vacant Land Prices Before Development in Bangkok and Surrounding Areas
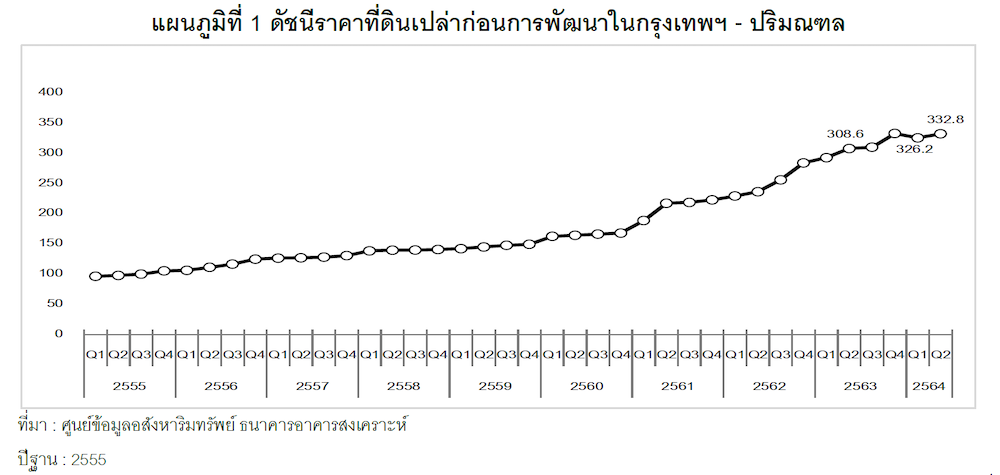
Source: Real Estate Information Center, Government Housing Bank
Base Year: 2012
Chart 2: Growth Rate of the Index of Vacant Land Prices Before Development in Bangkok and Surrounding Areas
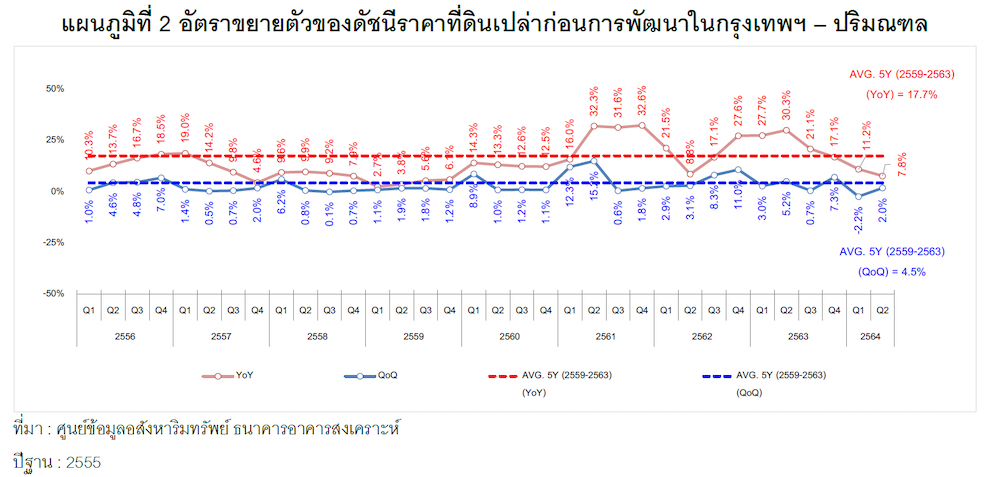
Source: Real Estate Information Center, Government Housing Bank
Base Year: 2012
Additionally, the report indicates that in Q2 2021, the prices of vacant land before development in areas with electric train routes saw the highest growth rates in the top 5 locations (see Table 2 and map).
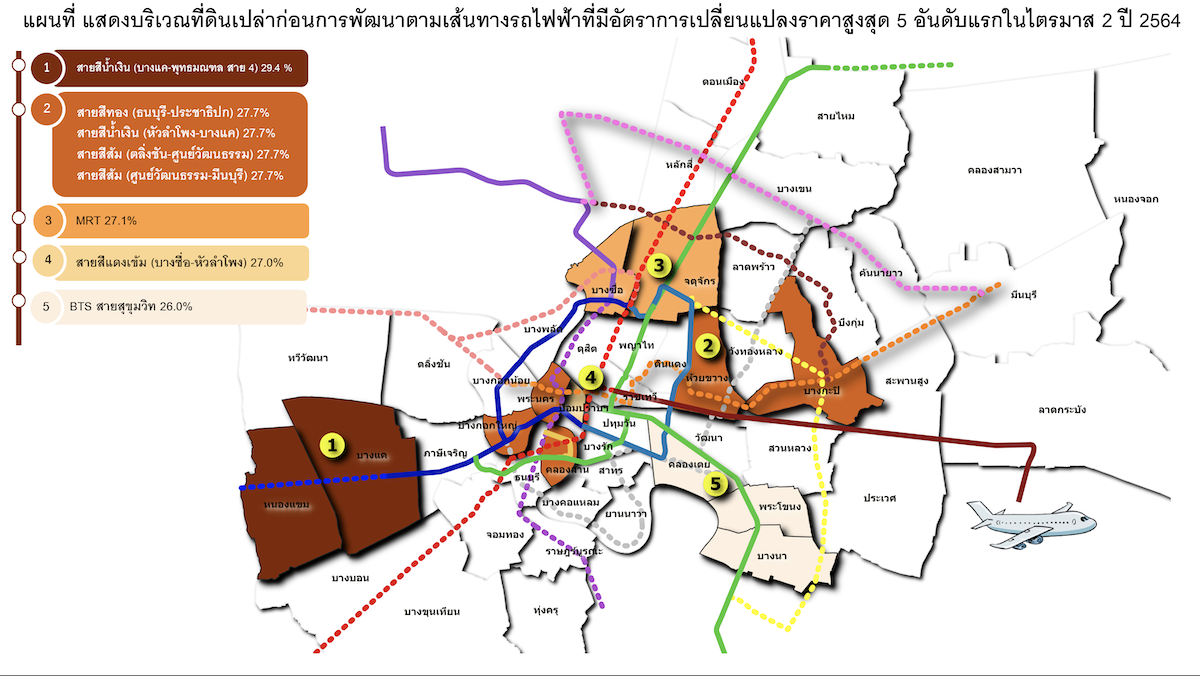
- Rank 1: Blue Line (Bang Khae - Phutthamonthon Sai 4), which is a project planned for future construction, located in the western zone of Bangkok, saw a price increase of 29.4% compared to the same period last year (YoY). The land prices in the areas of Nong Khaem and Bang Khae have consistently ranked first for three consecutive quarters. This price change is a direct result of the price changes along the Blue Line (Hua Lamphong - Bang Khae) that is already in operation.
- Rank 2: Gold Line (Thonburi - Prachathipok) and Blue Line (Hua Lamphong - Bang Khae), which are operational electric train projects, along with the Orange Line (Cultural Center - Min Buri) currently under construction, and the Orange Line (Taling Chan - Cultural Center) planned for future construction, all saw a price increase of 27.7% YoY. The areas of Bangkok Yai, Khlong San, Phra Nakhon, Huai Khwang, and Bang Kapi have experienced significant price increases. Notably, land along the Gold Line (Thonburi - Prachathipok), which just opened at the end of 2020, has ranked second for two consecutive quarters.
- Rank 3: MRT, which is an operational project, saw a price increase of 27.1% YoY, with significant price increases in the areas of Bang Sue and Chatuchak.
- Rank 4: Dark Red Line (Bang Sue - Hua Lamphong), a project planned for future construction, saw a price increase of 27.0% YoY, with significant price increases in the area of Pom Prap Sattru Phai.
- Rank 5: BTS Sukhumvit Line, an operational project, saw a price increase of 26.0% YoY, with significant price increases in the areas of Khlong Toei, Bang Na, and Phra Khanong.
Table 2: Index of Vacant Land Prices Before Development Along Electric Train Routes with the Highest Changes in Q2 2021 (YoY)
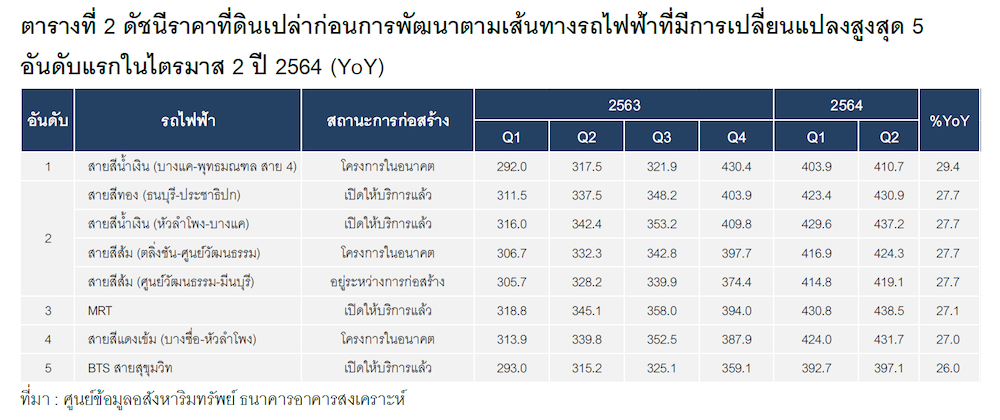
Source: Real Estate Information Center, Government Housing Bank
Data Collection Method
The Real Estate Information Center of the Government Housing Bank monitors changes in vacant land prices before development in the Bangkok and surrounding areas, covering 6 provinces: Bangkok, Nonthaburi, Pathum Thani, Samut Prakan, Samut Sakhon, and Nakhon Pathom, with 2012 as the base year, and compiles the index quarterly.
The study utilizes data on the transfer of vacant land ownership from the Land Department, selecting only vacant land without buildings, with a minimum size of 200 square wah, and focusing solely on transfers involving "juristic persons" as the transferor or transferee, as these typically reflect actual sale prices. Real estate development companies must accurately record expenses or revenues to calculate taxes and expenses each year.
The index calculation employs the Chain Laspeyres method, using the average price per square wah of vacant land, weighted by the value of land ownership transfers in the Bangkok and surrounding areas from 2012 to 2016. Factors analyzed through multiple regression analysis include:
1) Location of the land
2) Land use plan
3) Electric train routes passing through