Knight Frank Thailand Reveals Office Market Trends in Bangkok: Average Rent for Grade A Buildings Hits Record High
Key Highlights
- The average rent for Grade A buildings has increased to 1,000 Baht per square meter for the first time, driven by demand significantly outpacing supply.
- New office space leased in Bangkok totaled 55,943 square meters in Q4 2017.
- The Sukhumvit area between Asoke and Chidlom remains a popular location, with an occupancy rate of 96.58%.
- By the end of 2017, total office space in Bangkok reached approximately 4.92 million square meters, with an additional 171,000 square meters expected to be added in 2018.
According to a research report by Knight Frank Thailand, it is anticipated that around 171,000 square meters of new supply will enter the market in 2018, all located outside the Central Business District (CBD). Co-working spaces and serviced offices are among the fastest-growing workspaces in Bangkok, with the number of co-working spaces expanding from fewer than 20 to over 100 in the past five years. However, traditional office spaces remain the most popular choice, and the growth of co-working spaces will not hinder the office market, as both segments can grow simultaneously.
Rental Rates
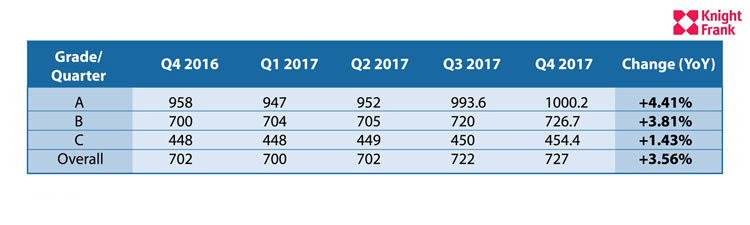
In 2017, rental rates for Grade A office buildings reached a historic high, with the average rent hitting 1,000 Baht/sq.m./month for the first time. The average rental rate was 727 Baht/sq.m./month, reflecting a year-on-year increase of 3.56% from 702 Baht/sq.m./month in Q4 2016. Meanwhile, rental rates for Grade B buildings were at 726.7 Baht/sq.m./month, and Grade C buildings at 454.4 Baht/sq.m./month, with increases of 3.8% and 1.4% year-on-year, respectively.
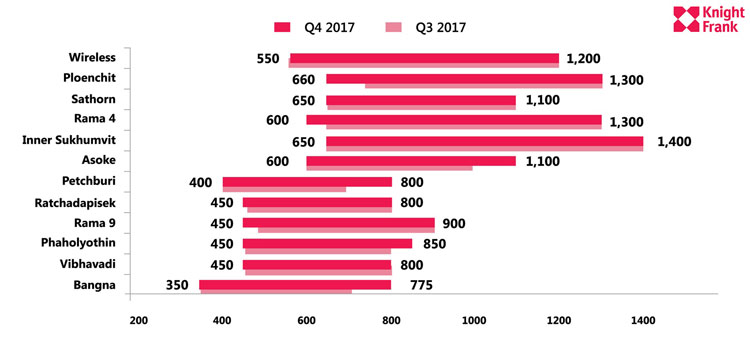
In 2017, office buildings on Sukhumvit Road between Asoke and Chidlom continued to be the most sought-after, with an average occupancy rate of 96.58%. Additionally, there was a notable increase in rental rates, with a maximum profit increase of 7.4% throughout the year.
Graph 1
Office Rental Rates in Bangkok by Grade, 2012 - 2017
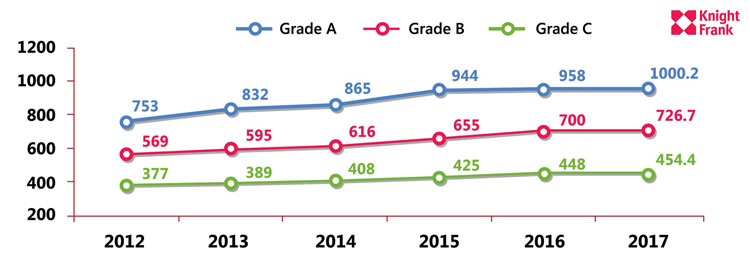
Source: Knight Frank Thailand
Table 1
Office Rental Rates by Grade and Percentage Increase (%)
Source: Knight Frank Thailand
Graph 2
Office Rental Rates in Bangkok by Main Roads, Q3 - Q4 2017
Source: Knight Frank Thailand
Demand
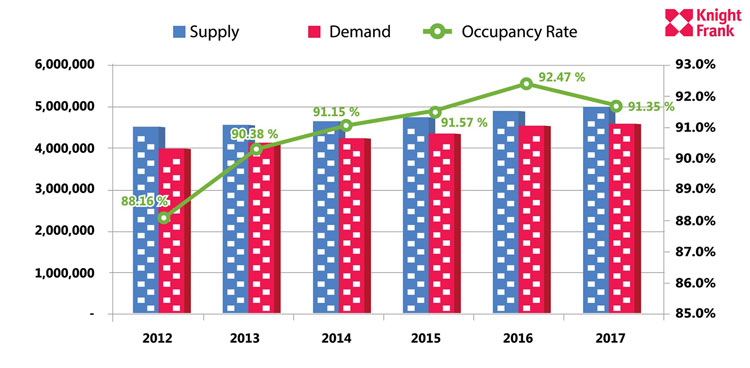
In Q4 2017, the total occupied area was 4,546,138 sq.m., reflecting an overall occupancy rate of 91.35%, a decrease of 1.1% year-on-year, but this trend was not consistent throughout the year.
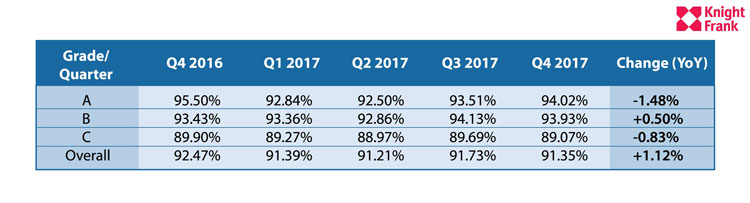
Grade A buildings had an occupancy rate of 94.02%, showing improvement throughout the year compared to 93.51% in Q3 2017, while Grade B and C buildings had occupancy rates of 93.93% and 89.07%, respectively.
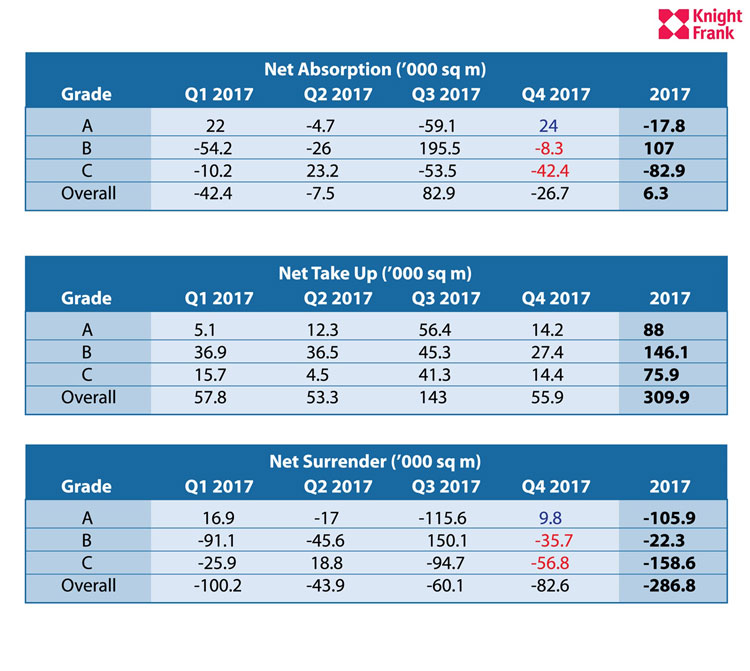
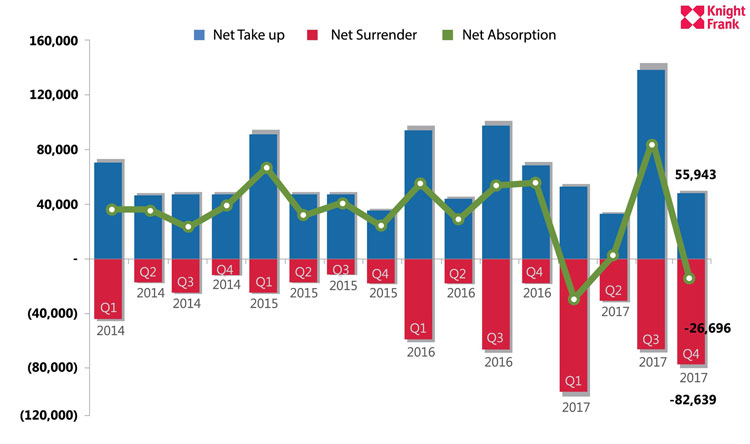
The net absorption rate (or the amount of new office space leased) in Bangkok for Q4 2017 was 55,943 sq.m., while 82,639 sq.m. were vacated or returned to owners, resulting in a net absorption decrease of -26,696 sq.m.
However, while the overall market saw a decrease in occupancy, Grade A buildings experienced a net absorption increase of 24,000 sq.m. in Q4.
Nonetheless, the reduced net absorption in some Grade C buildings was due to the temporary closure of two buildings for renovations, expected to reopen by late 2019.
According to Table 3, the overall net absorption in 2017 was only 6,300 sq.m., with only Grade B buildings showing an increase. A noticeable change was the higher occupancy rate of Grade B buildings and the lower rate of Grade C buildings. However, this trend was not observed in Grade A buildings, which had a total area of 88,000 sq.m. but approximately 106,000 sq.m. were returned to owners.
Additionally, tenants are attempting to control costs by opting to relocate to buildings with lower rents or improving the efficiency of their workspaces.
Graph 3
Demand, Supply, and Occupancy Rates of Office Buildings, 2012-2017
Source: Knight Frank Thailand
Note: These figures do not include buildings with multiple owners and buildings with less than 5,000 sq.m.
Table 2
Occupancy Rates by Grade from Q1 2015 - Q4 2017
Source: Knight Frank Thailand
Table 3
Net Occupancy Rates, Increase and Decrease in Space Usage by Grade
Source: Knight Frank Thailand
Supply
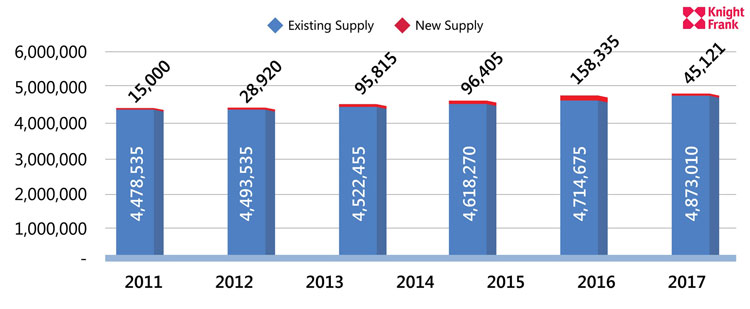
As of December 2017, the total supply of office space in Bangkok grew by 45,121 sq.m., bringing the total office area to 4,918,131 sq.m. after the completion of five new buildings.
Grade A buildings had a total leasable area of 1,313,526 sq.m., remaining stable from the previous year. Meanwhile, the total leasable area of Grade B buildings remained at 2,068,095 sq.m., while Grade C buildings had a total leasable area of approximately 1,536,010 sq.m., down from 1,614,375 sq.m. the previous year.
Graph 4
Net Occupancy Rates, Increase and Decrease in Space Usage Quarterly from Q1 2014 – Q4 2017
Source: Knight Frank Thailand
Note: These figures do not include buildings with multiple owners and buildings with less than 5,000 sq.m.
Future Supply
In 2018, five new projects will enter the market, with a total area of approximately 171,110 sq.m. In addition to the projects currently under construction, the total new supply will amount to 768,609 sq.m., or more than what will enter the market between 2019-2023. The total increase in office supply is expected to be around 6.0-6.2 million sq.m. by 2023.
Graph 5
Supply and New Supply of Offices in Bangkok from 2012-2017
Source: Knight Frank Thailand
Thank you for the information from www.knightfrank.co.th