Knight Frank Thailand Reveals Office Market Trends in Bangkok
Knight Frank Thailand Reveals Office Market Trends in Bangkok
Mr. Marcus Bertenshaw, Executive Director and Head of Brokerage at Knight Frank Thailand Ltd. stated, "Tenants in the Bangkok office market are facing challenges. Office renters will encounter rising rental rates, even when the quality and location remain similar. Therefore, planning is crucial at this time. We recommend that tenants conduct a thorough analysis and consider their office space selection plans at least one year before their lease expires, or even longer if they have additional space requirements or are foreign organizations."
Key Highlights
- Business confidence in the Thai economy is improving.
- The amount of new office space for rent in the Bangkok area expanded by approximately 36,368 square meters in Q2, but decreased by 1% from Q1.
The overall occupancy rate is at 82%.
- The average quarterly rental rate remains stable across the market but has increased by 5% year-on-year.
Supply
According to Knight Frank Thailand's research report, the total office supply in Q2 2017 stands at 4,877,670 square meters. Newly launched office buildings this year include Gaysorn Tower (32,312 square meters) and the Piriyachai Tower at BITEC (31,880 square meters). In the future, most new buildings over the next three years will be located outside the central business district, developing into new commercial areas.
Graph 1
Supply and New Supply of Offices in Bangkok from 2012 to Q2 2017
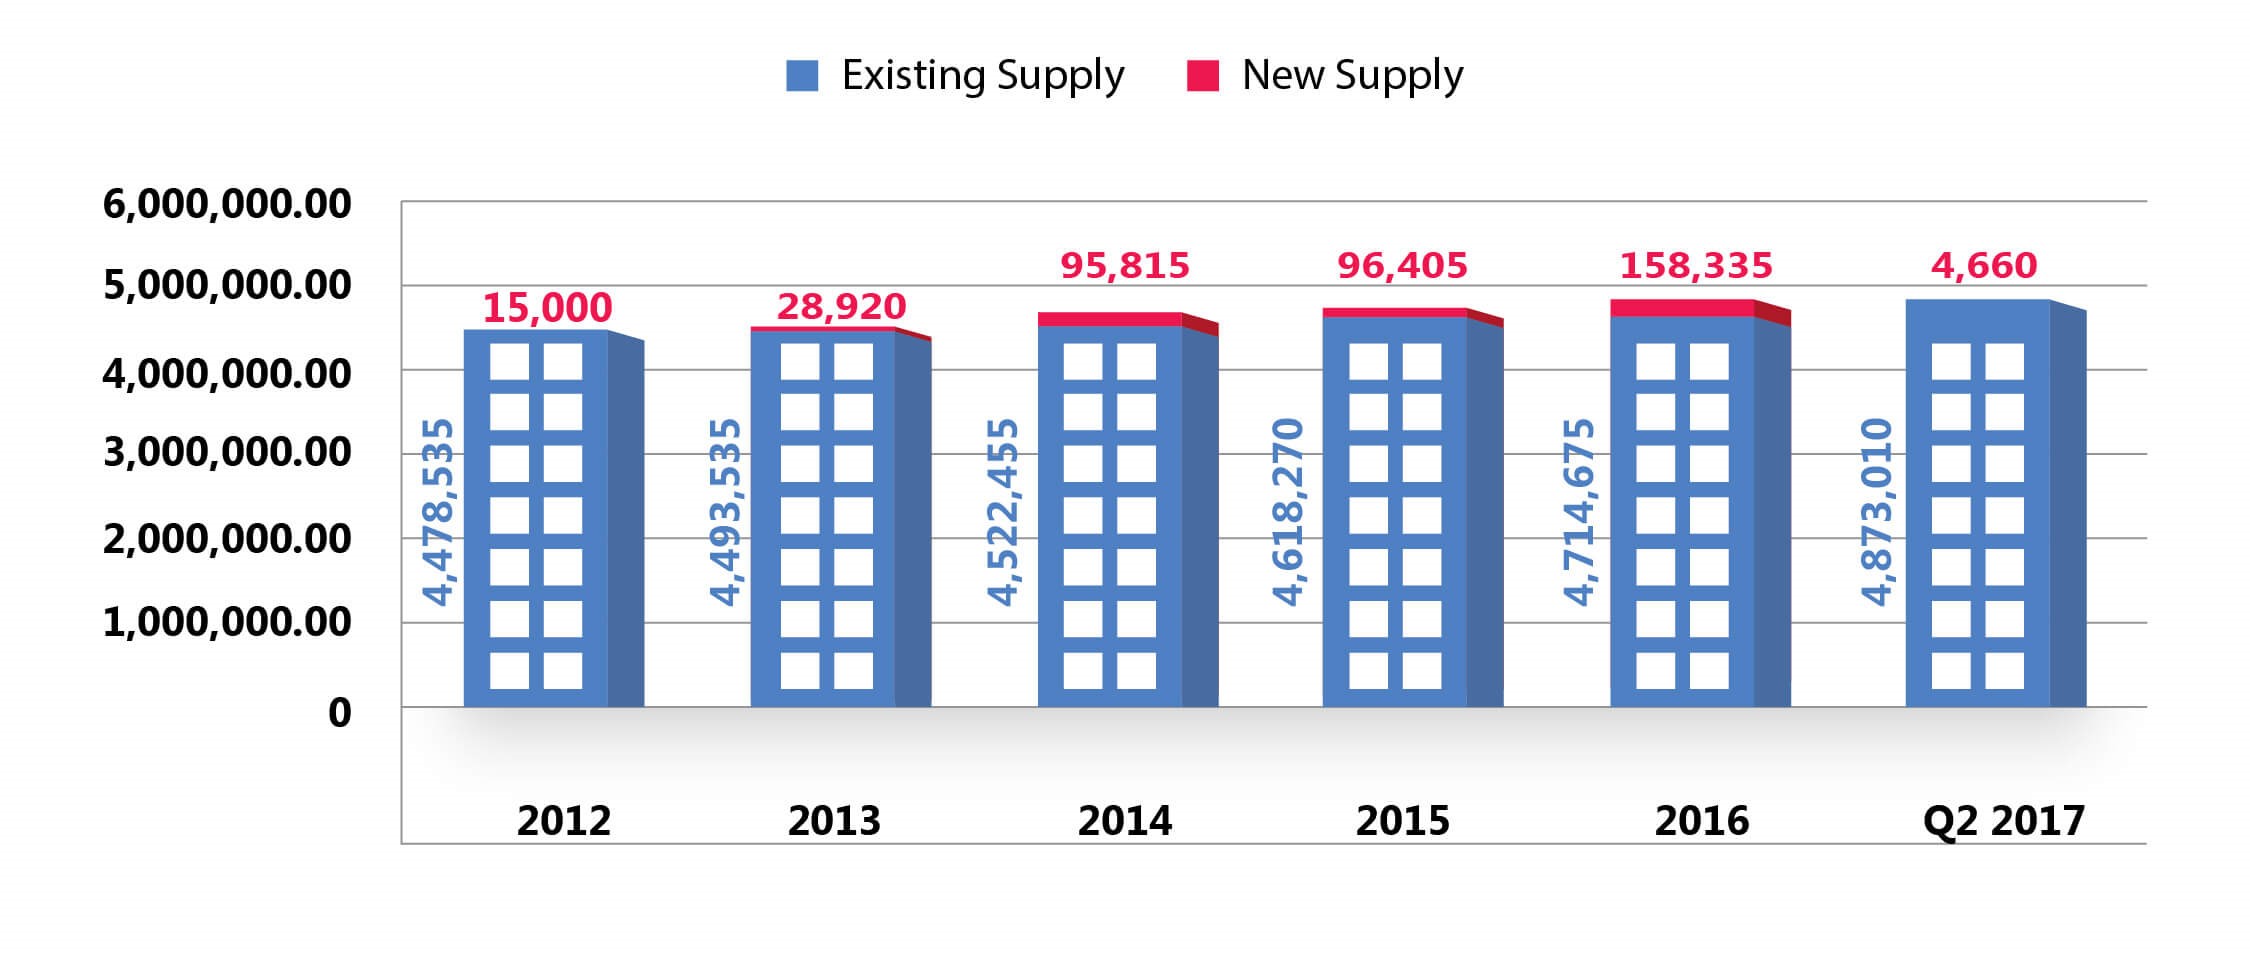
Source: Knight Frank Thailand
Note: These figures do not include buildings with multiple owners and buildings with less than 5,000 square meters of space.
Future Supply
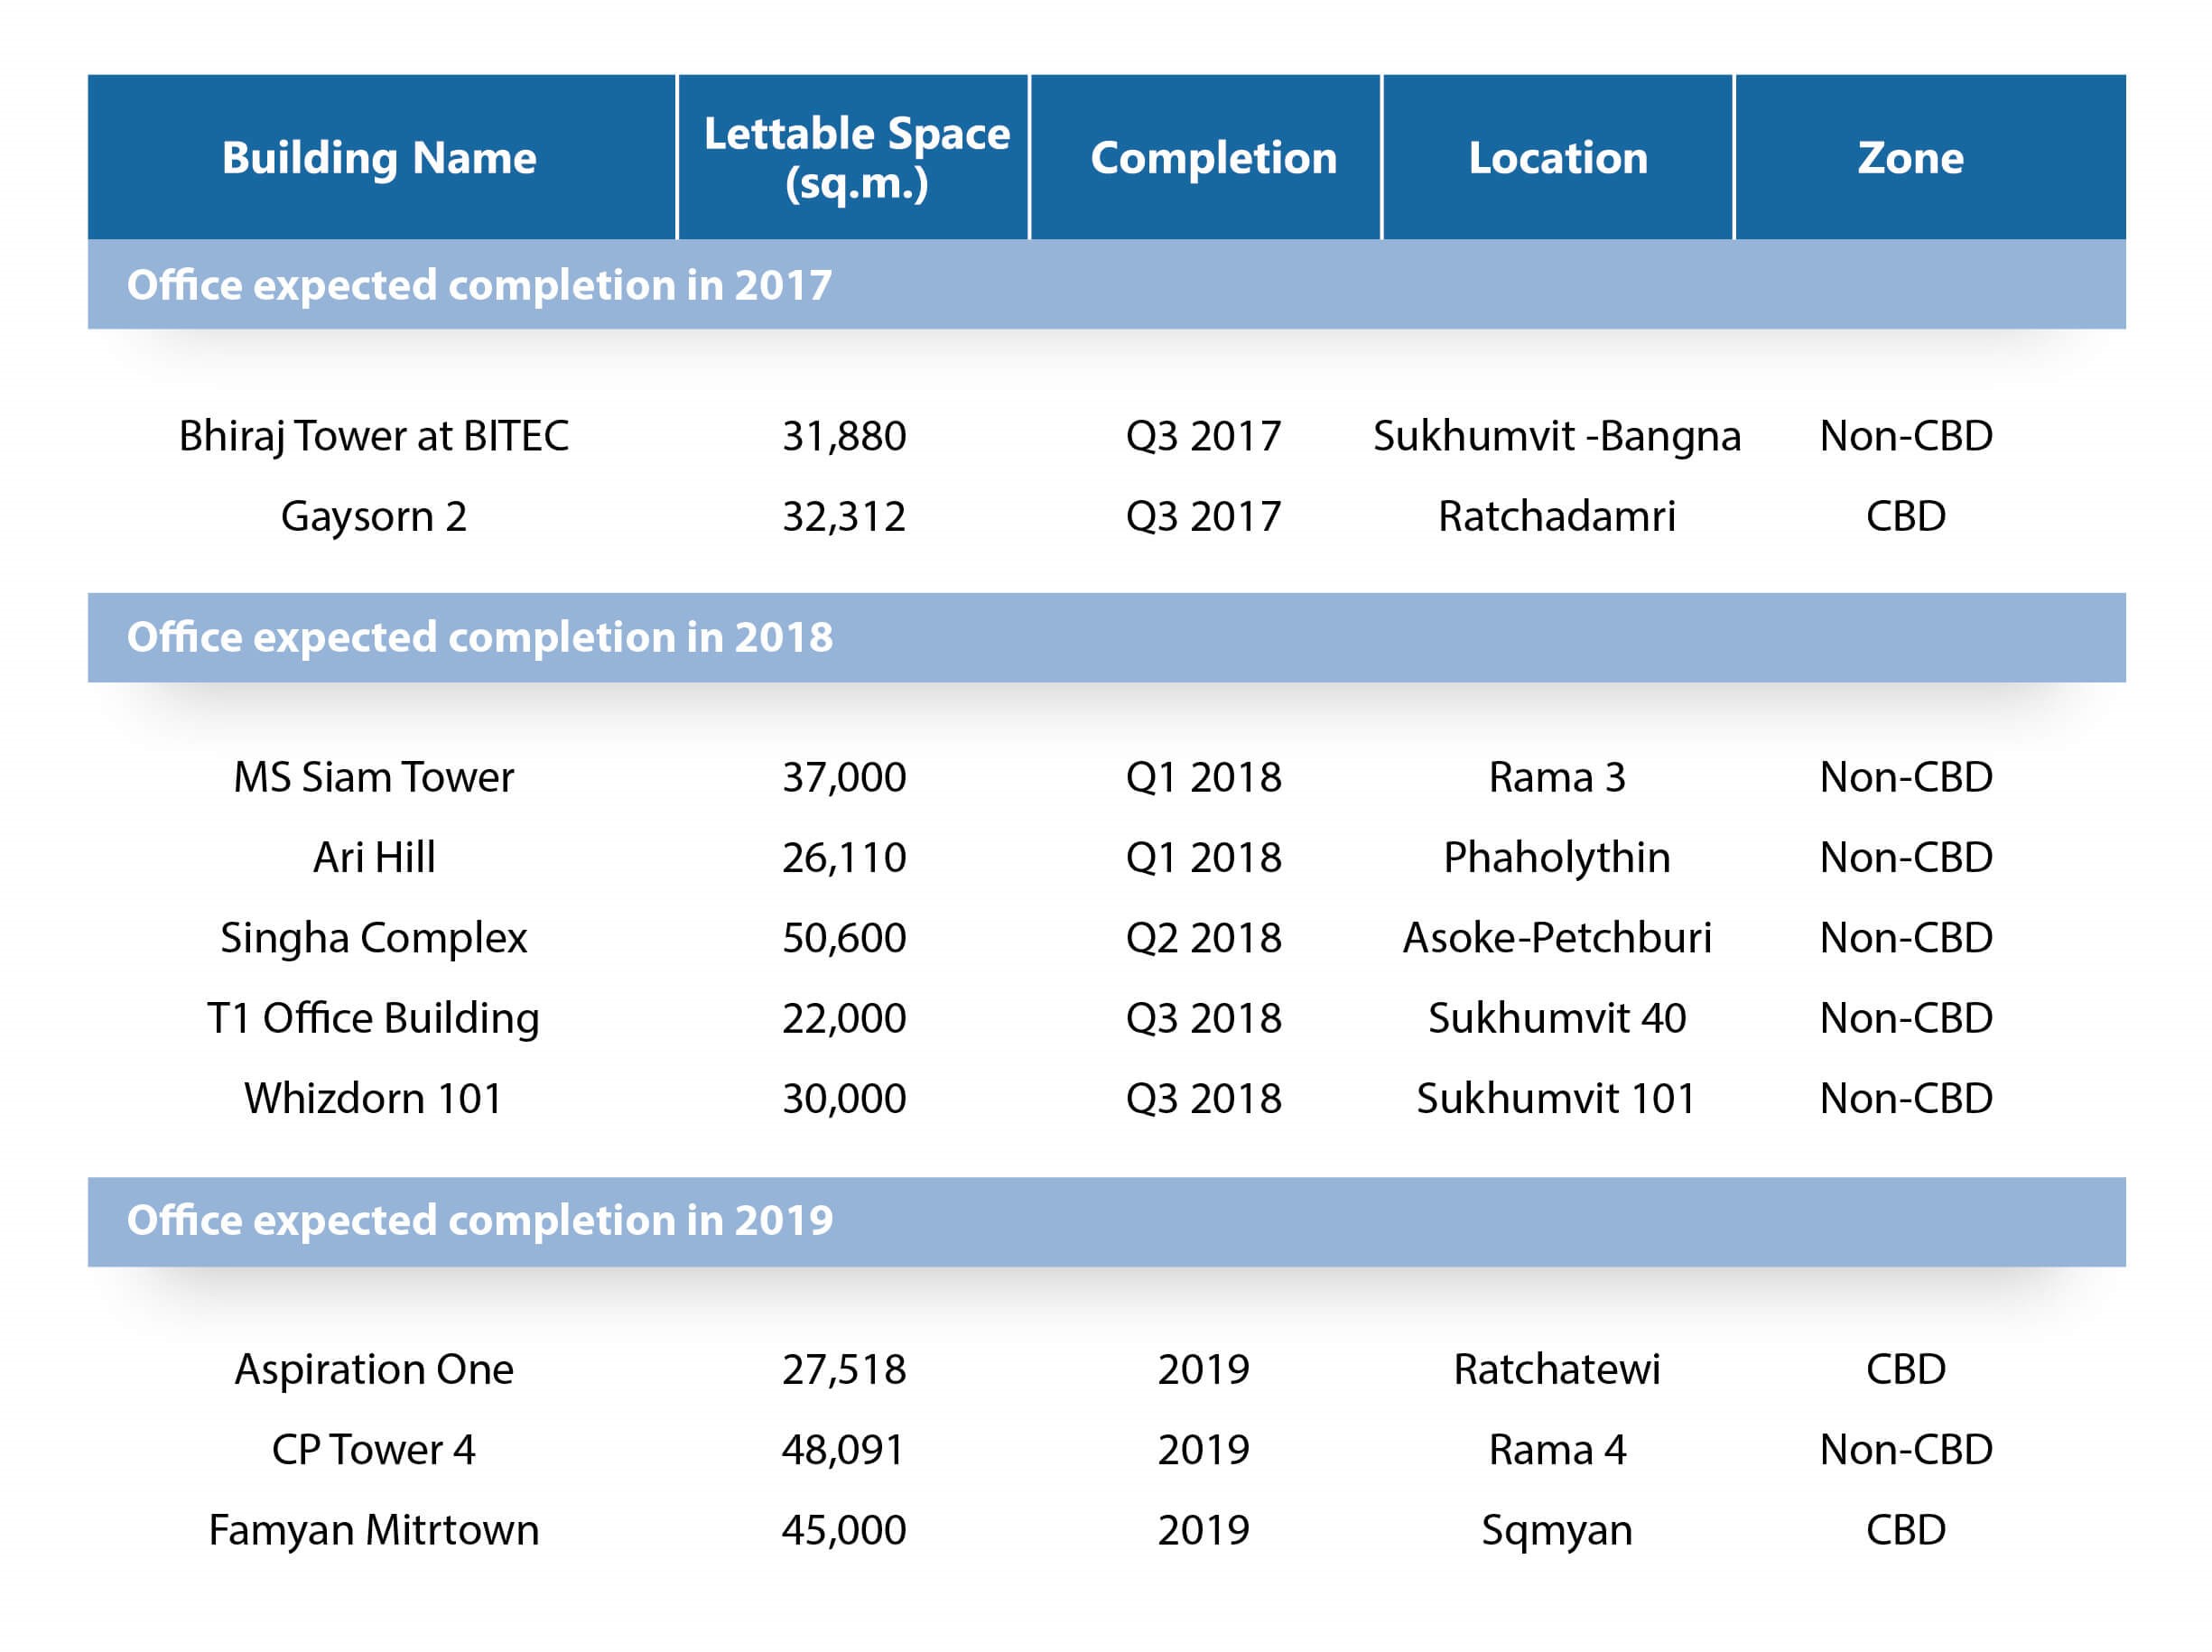
Research predicts that by the end of this year, an additional 64,192 square meters will enter the market, and by the end of 2019, new supply, including projects under construction, will total 350,511 square meters.
Table 1
Future Office Supply in Bangkok Expected to be Completed
Source: Knight Frank Thailand
Note: These figures do not include buildings with multiple owners and buildings with less than 5,000 square meters of space.
Future Supply
Research predicts that by the end of this year, an additional 64,192 square meters will enter the market, and by the end of 2019, new supply, including projects under construction, will total 350,511 square meters.
Table 1
Future Office Supply in Bangkok Expected to be Completed
Source: Knight Frank Thailand
Table 2
Total Future Office Supply in Bangkok
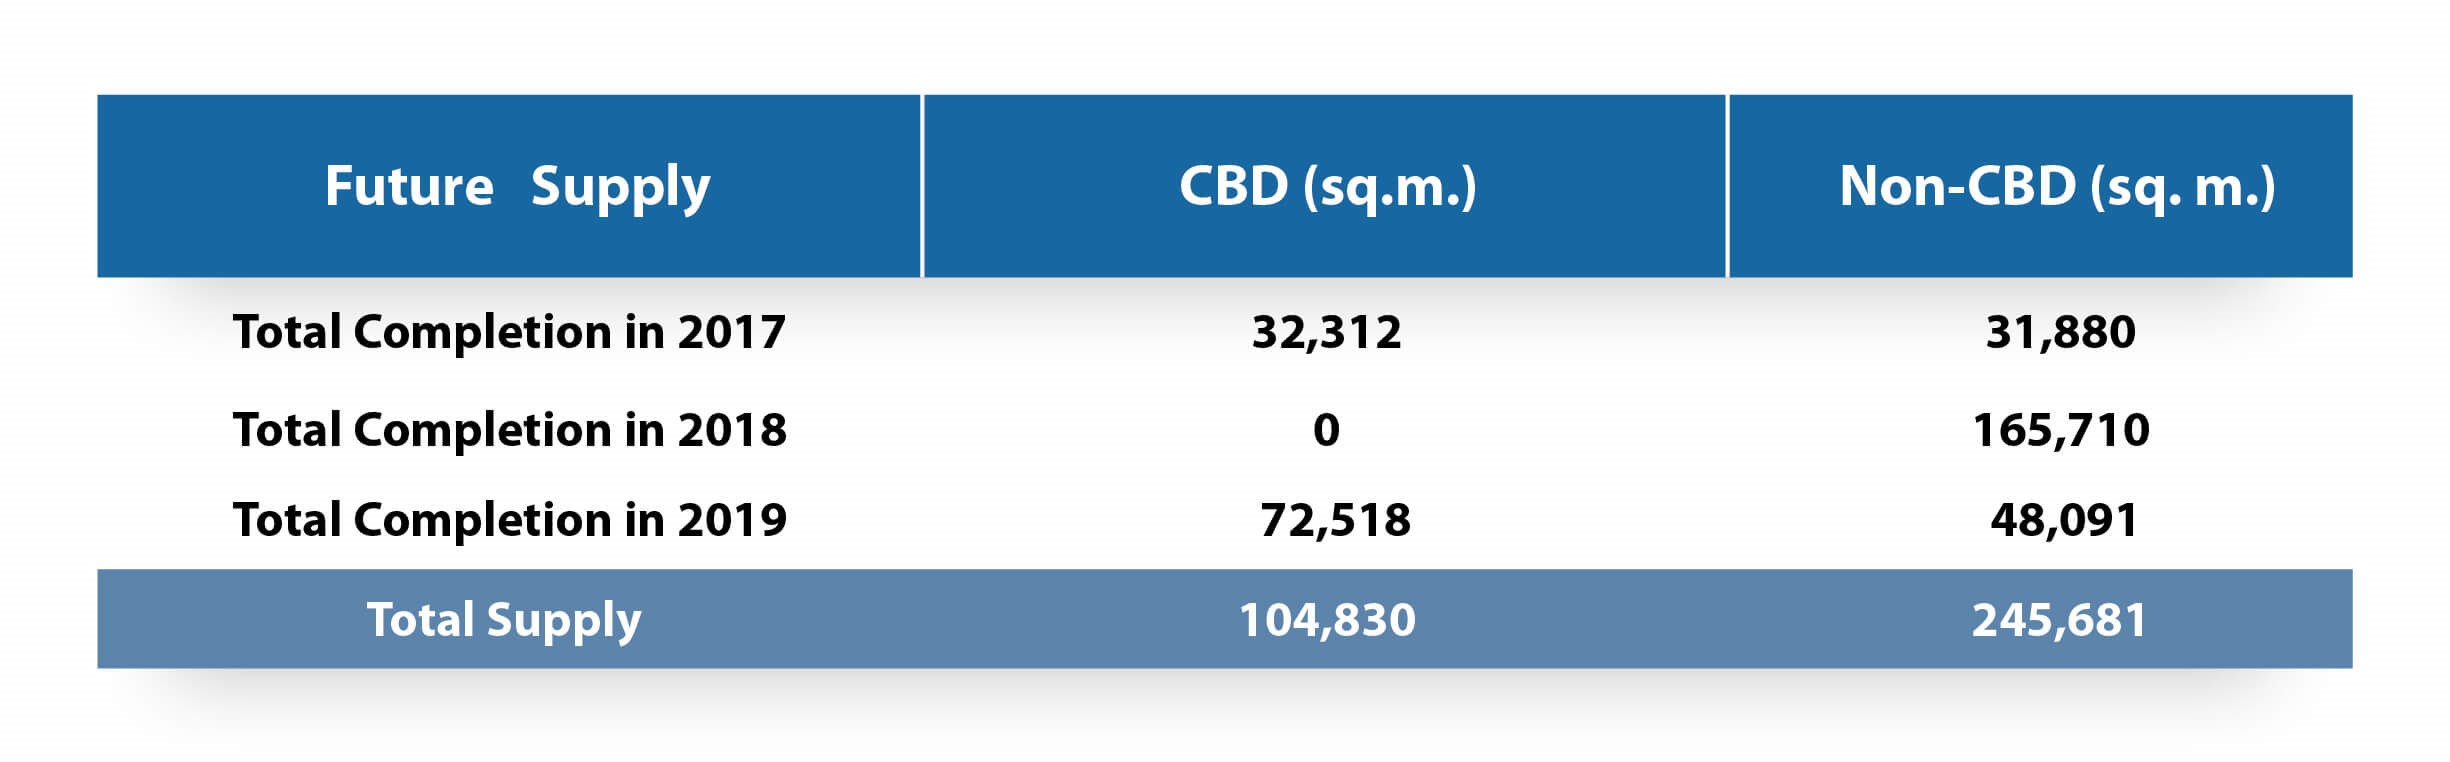
Source: Knight Frank Thailand
Demand
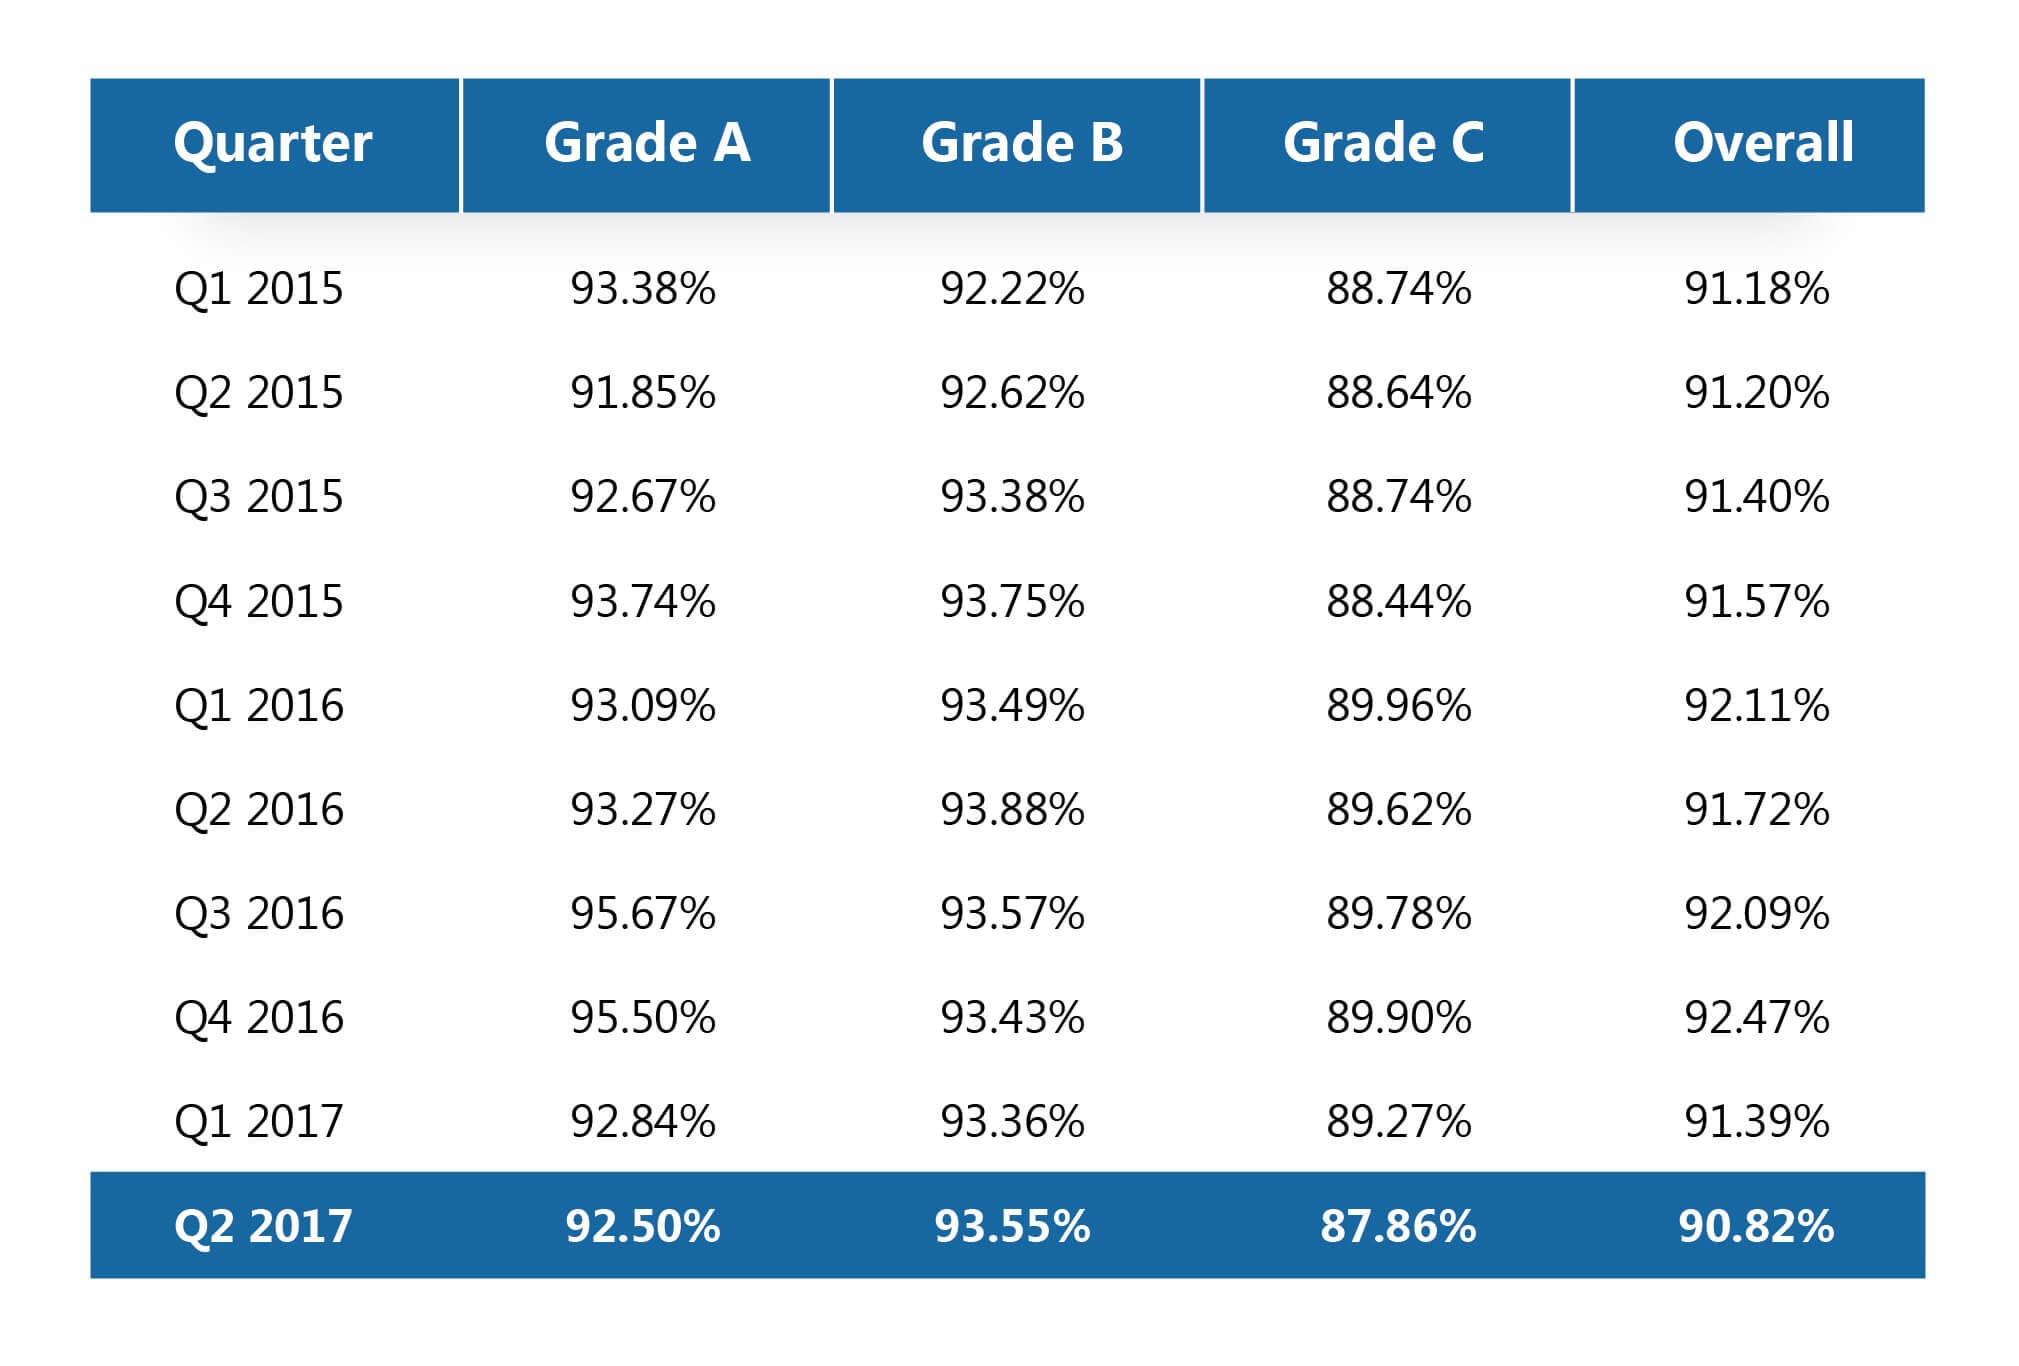
In Q2, the total occupied office space in the market reached 4,454,894 square meters, resulting in an overall occupancy rate of 90.82%. The average vacancy rate for Grade A buildings is 7.5%, Grade B is 6.45%, and Grade C is 12.14%. New office space for rent in the Bangkok area increased by approximately 36,368 square meters but decreased by 37.1% from the previous quarter. This demand shows only slight growth each year since 2012.
Note: These figures do not include buildings with multiple owners and buildings with less than 5,000 square meters of space.
Graph 2
Demand, Supply, and Occupancy Rates from 2012 to Q2 2017
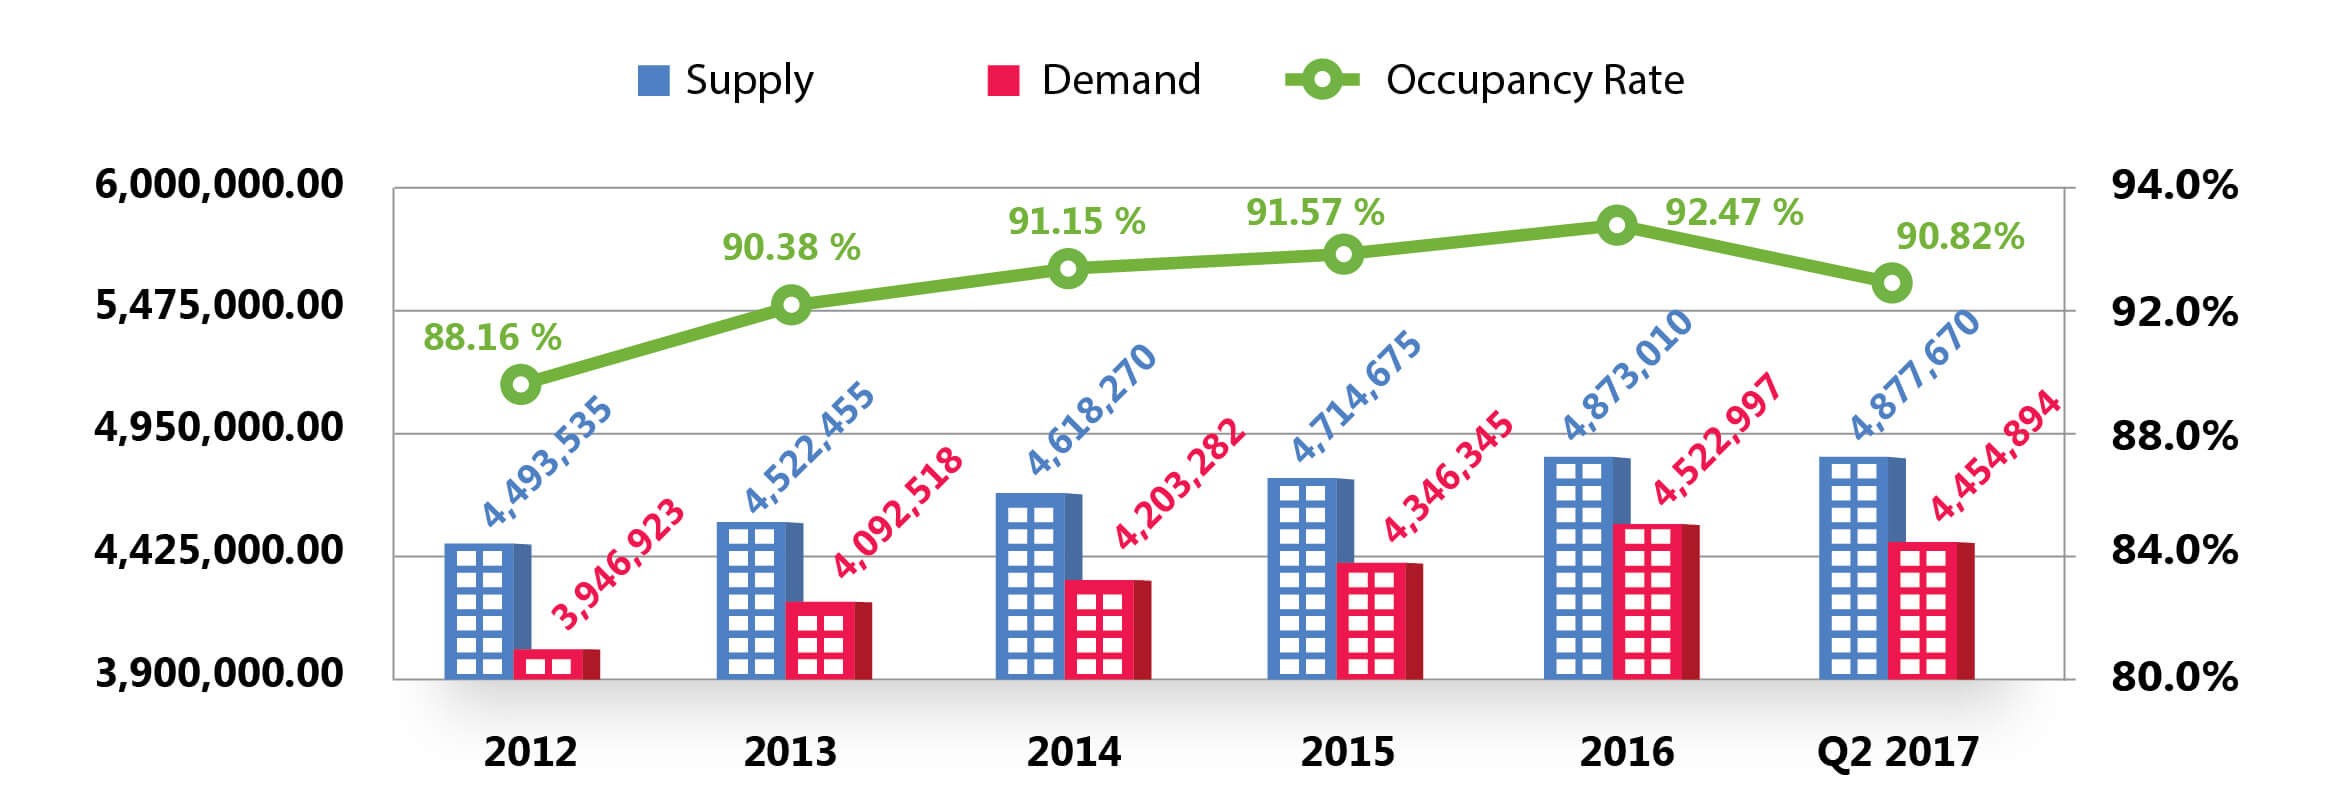
Source: Knight Frank Thailand
Graph 3
Supply and Demand Analysis of Bangkok Offices from Q1 2014 to Q2 2017
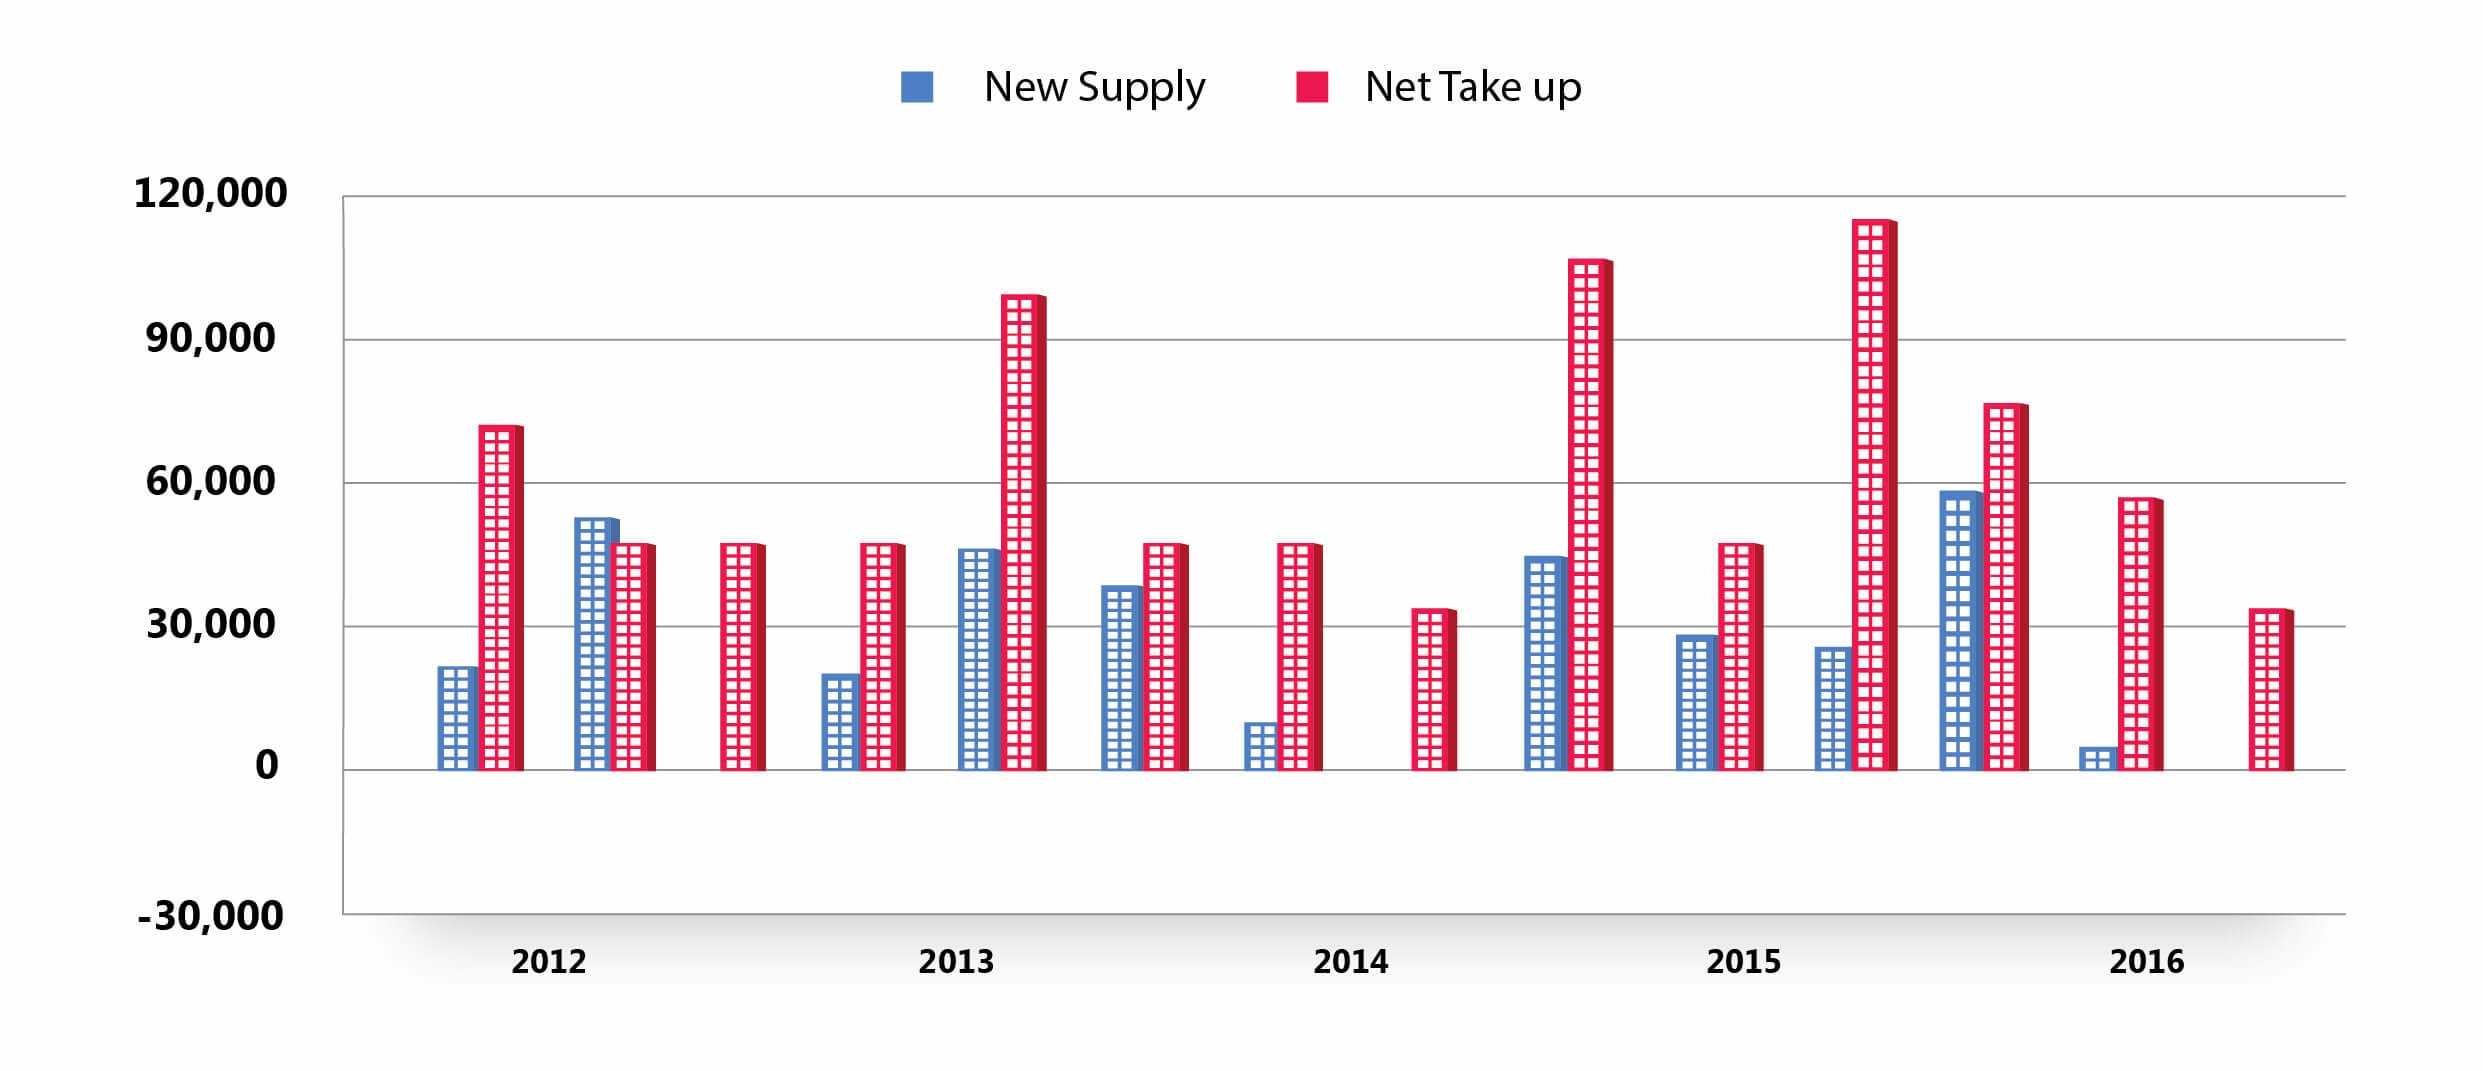
Source: Knight Frank Thailand
Table 3
Occupancy Rates by Grade from Q1 2015 to Q2 2017
Source: Knight Frank Thailand
Rental Rates
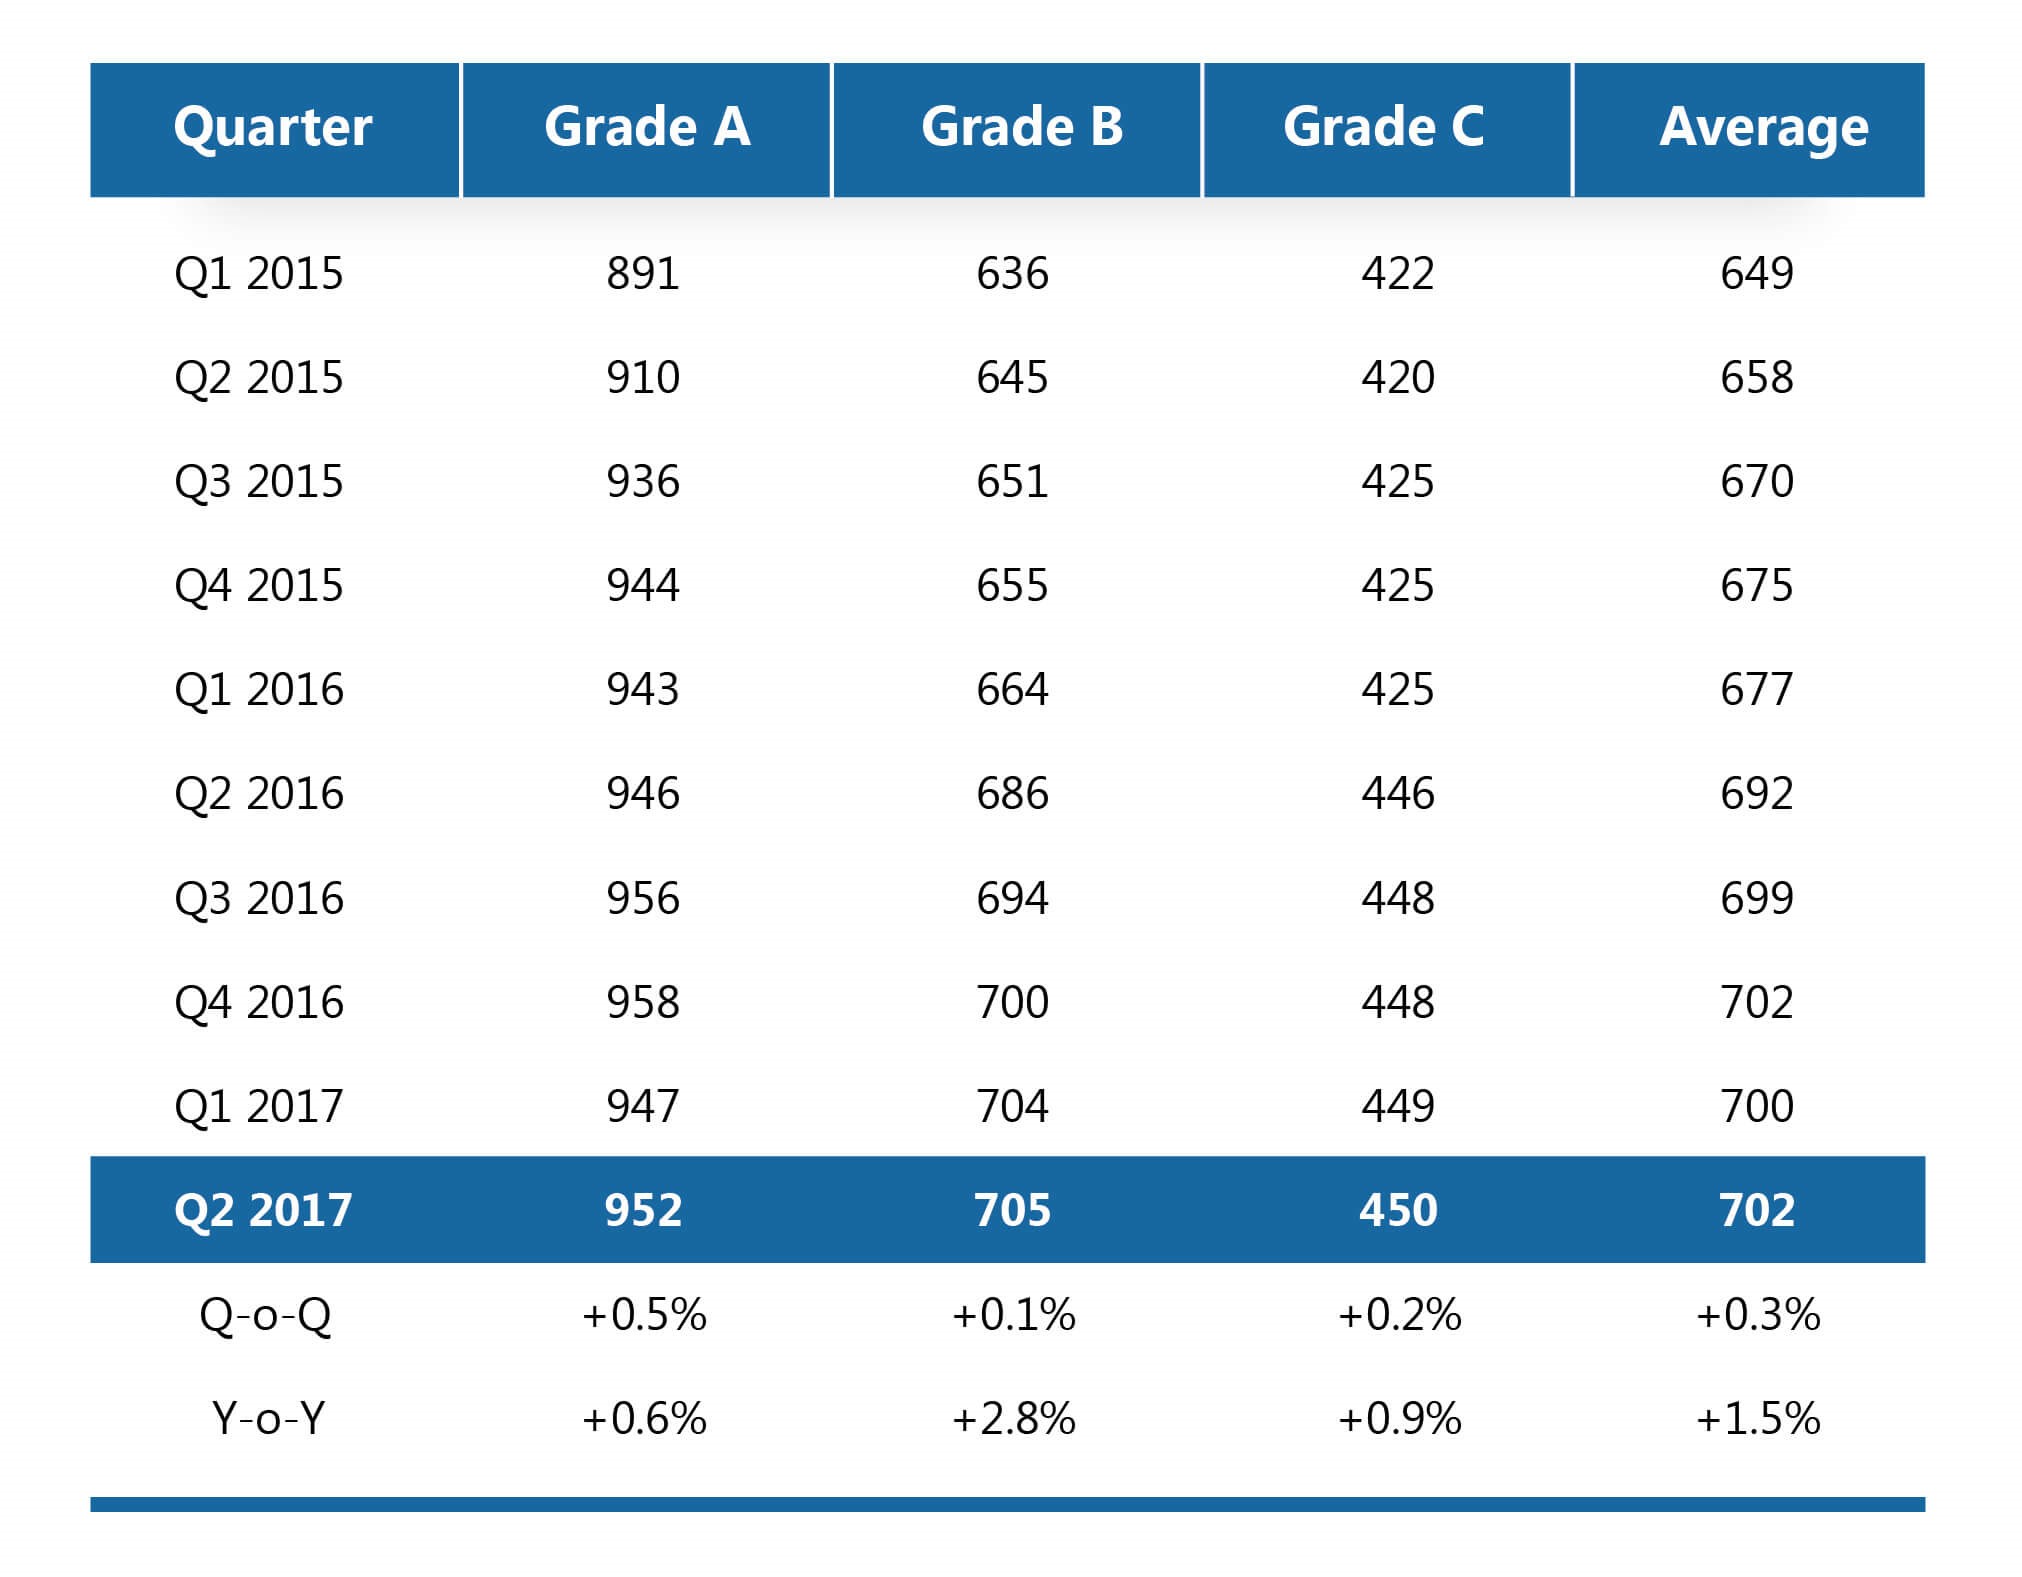
Rental rates for office space in Bangkok have been steadily increasing over the past six years. The average rental rate set in Q2 2017 is 702 THB/sq.m/month, which remains stable from the previous quarter. However, rental rates have increased by 1.5% compared to the same period last year, and this trend is expected to continue in Q3 and beyond.
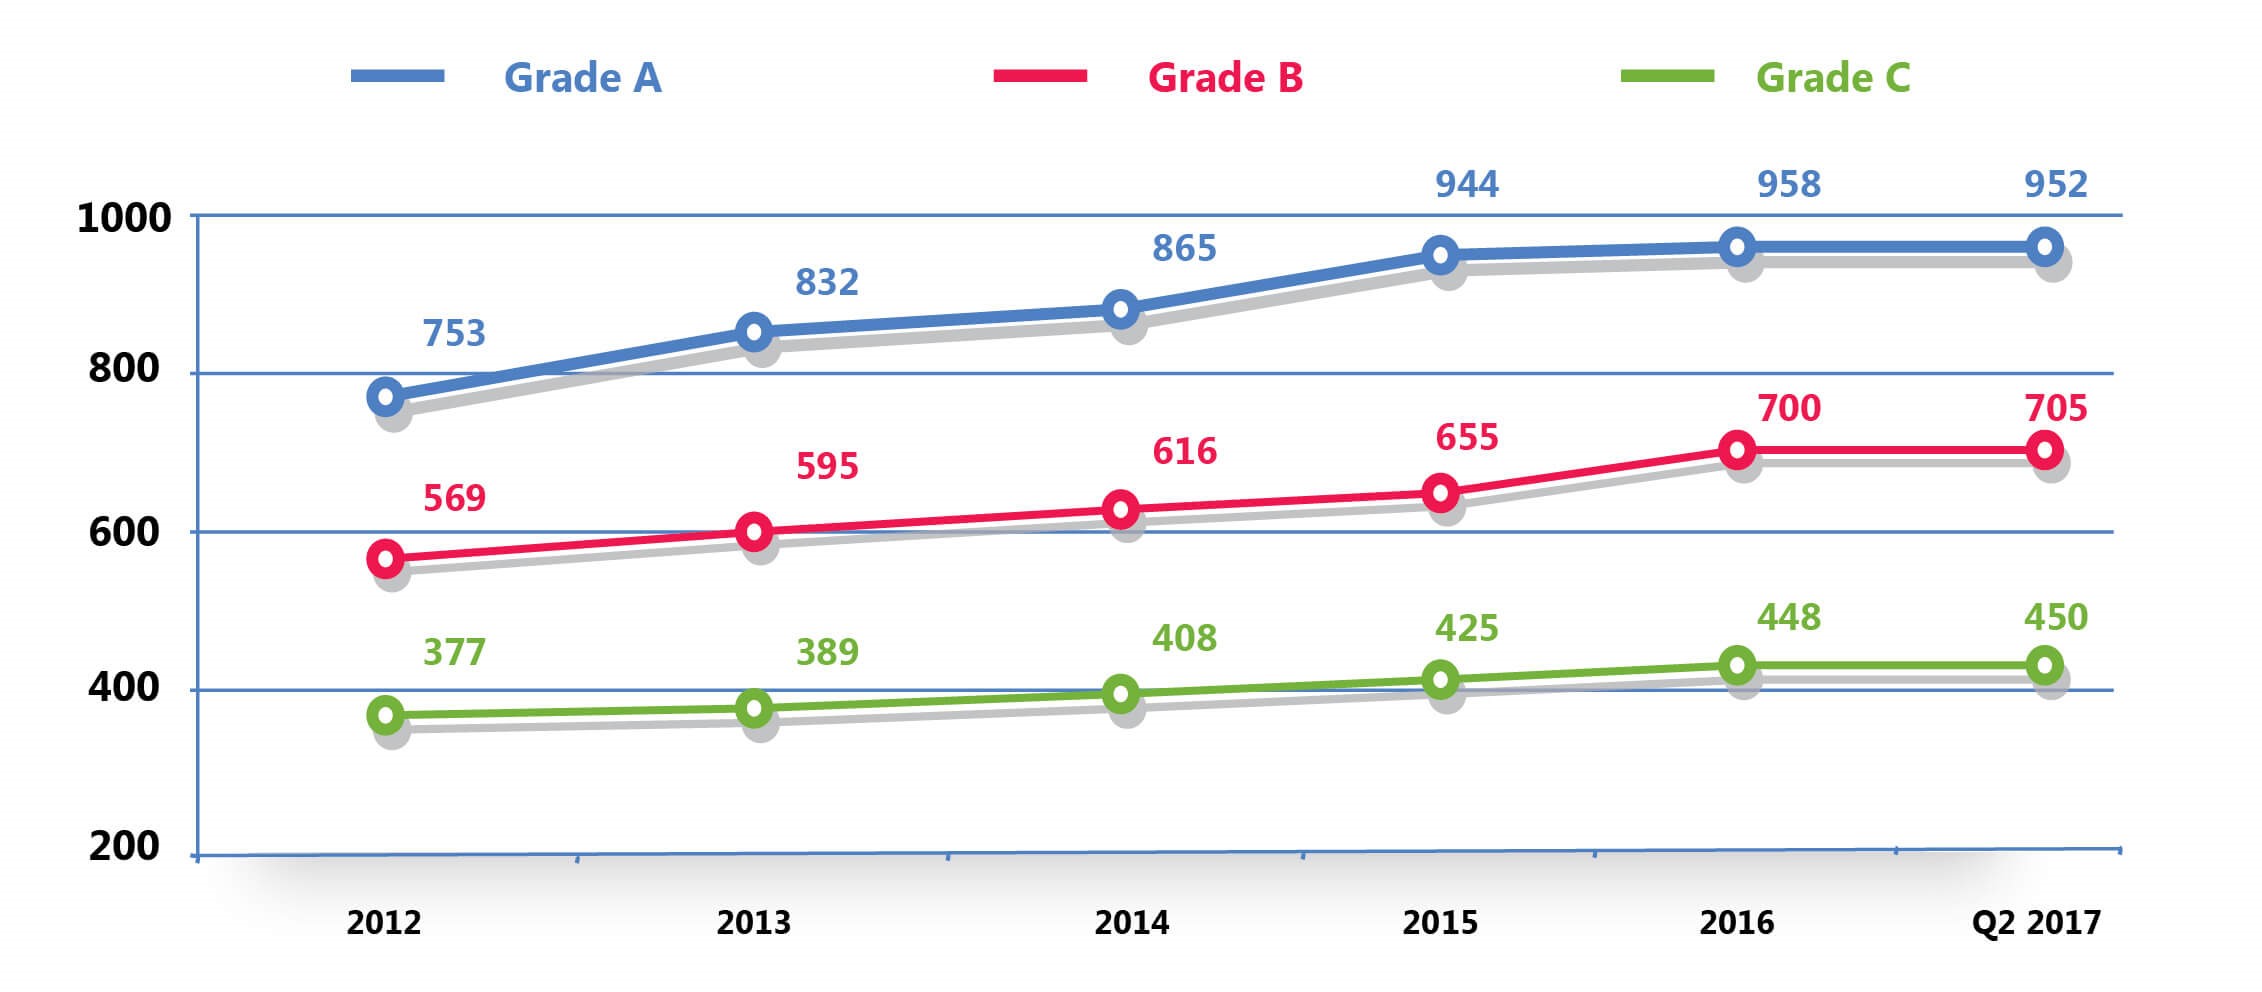
The average monthly rental rate for Grade A offices is 952 THB/sq.m/month, Grade B offices are 705 THB/sq.m/month, and Grade C offices are 450 THB/sq.m/month.
In Q2, we observed several office buildings in Bangkok setting rental rates above 1,000 THB/sq.m/month.
Graph 4
Rental Rates of Office Buildings in Bangkok by Grade from Q1 2015 to Q2 2017
Source: Knight Frank Thailand
Table 4
Rental Rates of Office Buildings by Grade and Percentage Increase (%)
Source: Knight Frank Thailand
Graph 5
Rental Rates of Office Buildings in Bangkok by Street in Q2 2017
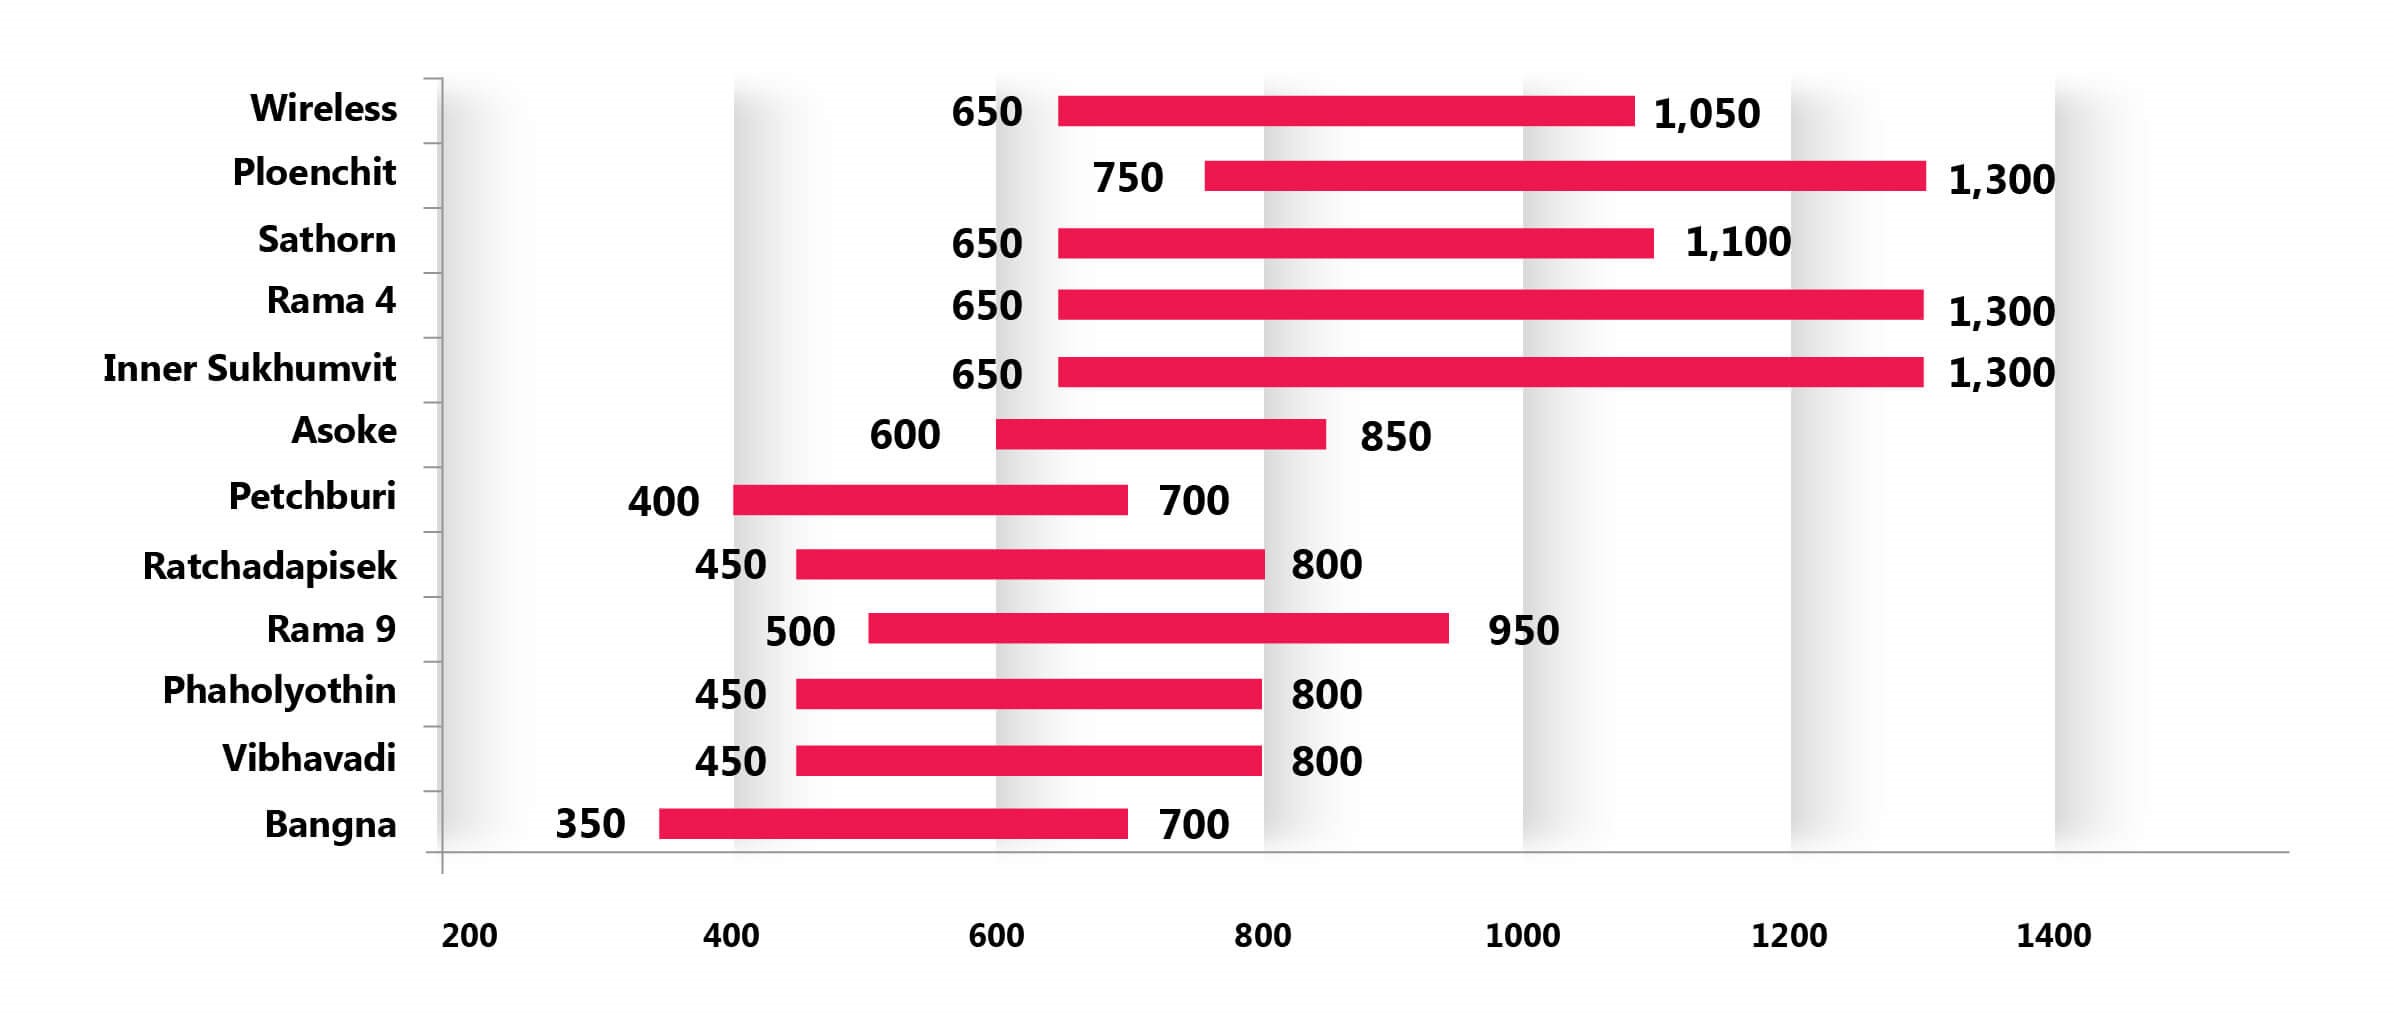
Source: Knight Frank Thailand
Thank you for the information from http://www.knightfrank.co.th/th