Index of Vacant Land Prices Before Development in Bangkok - Metropolitan Area Q2 2024
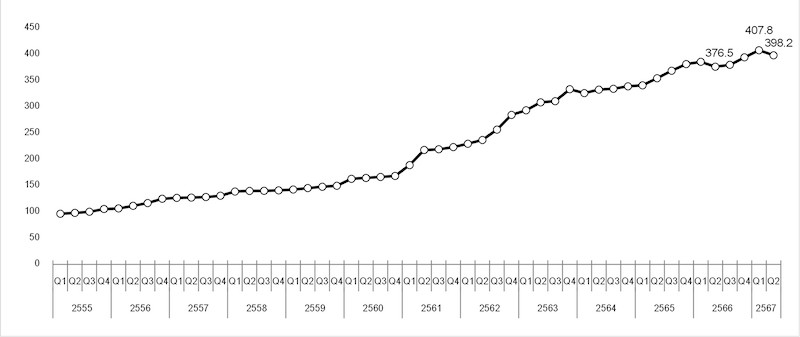
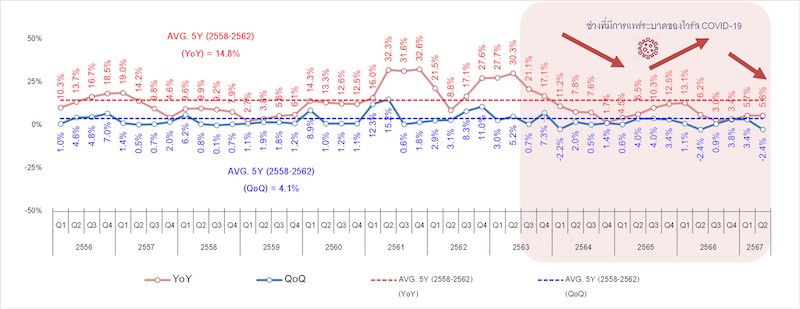
Real Estate Information Center, Government Housing Bank (REIC) reports that the index of vacant land prices before development in Bangkok - Metropolitan Area for Q2 2024 stands at 398.2 points, an increase of 5.8% compared to the same period last year (YoY), but a decrease of 2.4% compared to the previous quarter (QoQ). This indicates that the growth of vacant land prices before development continues to rise, albeit at a slower pace compared to the average increase rate of 14.8% per quarter (YoY) and 4.1% (QoQ) during the pre-COVID-19 crisis period (2015 - 2019). (See Table 1 and Charts 1 - 2)

Dr. Vichai Wiratkhapan, Inspector of the Government Housing Bank and Acting Director of the Real Estate Information Center stated that the slower increase in vacant land prices before development may be attributed to the sluggish recovery of the domestic economy and investment in recent times, compounded by significant negative factors.
These negative factors include the cancellation of LTV relaxation measures, a household debt level exceeding 90% of GDP, a stable policy interest rate at 2.50%, and financial institutions currently applying strict lending criteria, affecting the purchasing power and loan applications of potential home buyers.
These factors have led to a significant slowdown in the real estate sector, which may result in reduced demand from developers for land acquisition, as they face holding costs from land and property taxes. In 2024, the government has no measures to reduce land and property taxes, and some developers have expanded their markets to key provinces in other regions, further contributing to the overall slowdown in land demand in Bangkok - Metropolitan Area.
Table 1: Index of Vacant Land Prices Before Development in Bangkok - Metropolitan Area Q2 2024

Source: Real Estate Information Center, Government Housing Bank
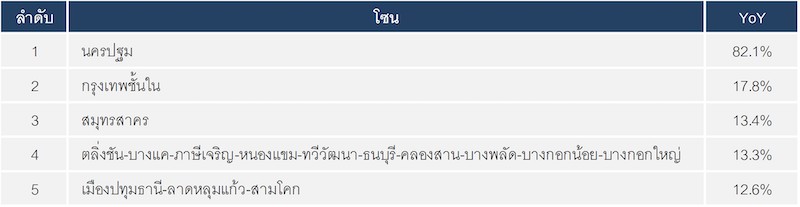
In Q2 2024, the zones with the highest growth rates in land prices compared to the same quarter last year (YoY) are as follows (See Table 2):
- 1st: Nakhon Pathom zone, with a land price change rate of 82.1%
- 2nd: Inner Bangkok zone (including Chatuchak, Huai Khwang, Yan Nawa, Wattana, Khlong Toei, Phaya Thai, Bang Kho Laem, Pom Prap Sattru Phai, Bang Sue, Din Daeng, Ratchathewi, and Bang Rak) with a land price change rate of 17.8%
- 3rd: Samut Sakhon zone, with a land price change rate of 13.4%
- 4th: Taling Chan-Bang Kha-Phasi Charoen-Nong Khaem-Tawiwat-Thonburi-Khlong San-Bang Phlat-Bangkok Noi-Bangkok Yai zone, with a land price change rate of 13.3%
- 5th: Pathum Thani-Lat Lum Kaeo-Sam Khok zone, with a land price change rate of 12.6%
The changes in land prices reflect that land in the suburban areas of Bangkok and the metropolitan area continues to see price increases, driven by urban expansion due to the development of road systems and mass transit projects.
The new rail systems and extensions have made commuting in and out of the city much more convenient. Additionally, land prices in suburban areas remain relatively low, allowing developers to create horizontal residential projects that align with the purchasing power of those seeking affordable housing, while also developing commercial areas in the suburbs. This makes suburban areas a good option for those looking to buy affordable housing, leading to increased residential development in these areas.
Meanwhile, land prices in the inner Bangkok zone have been continuously rising, likely due to large-scale projects by both the government and private sectors, often in the form of mixed-use developments that include office buildings, commercial spaces, and high-rise residential buildings. Land transactions in the inner Bangkok zone typically involve smaller plots with high values, often developed into condominium projects. This aligns with data from the Q1 2024 housing survey, which found that the inner Bangkok zone saw a 269.1% increase in new condominium project launches, resulting in rapid growth in key urban connection areas and increased land demand, consequently driving up land prices, particularly in the western Bangkok zone, including Taling Chan-Bang Kha-Phasi Charoen-Nong Khaem-Tawiwat-Thonburi-Khlong San-Bang Phlat-Bangkok Noi-Bangkok Yai extending to Nakhon Pathom.
Table 2: Top 5 Zones with the Highest Price Changes Q2 2024
Source: Real Estate Information Center, Government Housing Bank
Chart 1: Index of Vacant Land Prices Before Development in Bangkok - Metropolitan Area
Source: Real Estate Information Center, Government Housing Bank, with 2012 as the base year
Chart 2: Growth Rate of the Index of Vacant Land Prices Before Development in Bangkok - Metropolitan Area
Source: Real Estate Information Center, Government Housing Bank, with 2012 as the base year
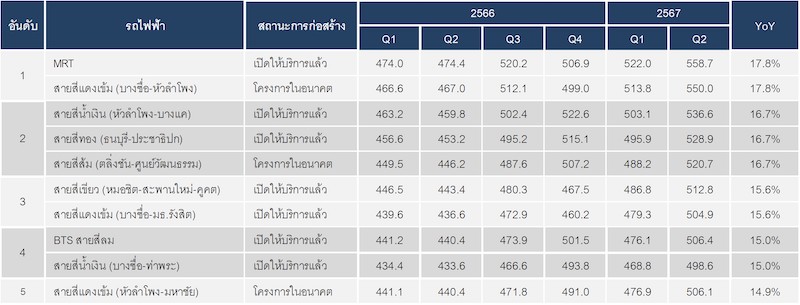
For vacant land prices before development along the routes with electric trains in Q2 2024, the top 5 electric train routes with the highest land price growth rates compared to the same quarter last year (YoY) are primarily located where electric train projects are already operational and are areas with stations that connect between train lines or are easily accessible. The details are as follows:
- 1st: Blue Line (MRT) is an operational project, and the Dark Red Line (Bang Sue-Hua Lamphong) is a future project, with indices of 558.7 points and 550.0 points respectively, showing a land price growth rate of 17.8% YoY, with significant price increases in Sathorn, Phaya Thai, and Din Daeng districts.
- 2nd: Blue Line (Hua Lamphong-Bang Khae) is an operational project, the Gold Line (Thonburi-Phra Chathipok) is operational, and the Orange Line (Taling Chan-Cultural Center) is a future project, with indices of 536.6 points, 528.9 points, and 520.7 points respectively, showing a land price growth rate of 16.7% YoY, with significant price increases in Phasi Charoen, Bang Phlat, and Thonburi districts.
- 3rd: Green Line (Mo Chit-Sapan Mai-Khukhot) is an operational project, and the Dark Red Line (Bang Sue-Thammasat Rangsit) is partially operational, with indices of 512.8 points and 504.9 points respectively, showing a land price growth rate of 15.6% YoY, with significant price increases in Lam Luk Ka, Thanyaburi, and Bang Khen districts.
- 4th: Silom Line (BTS) is an operational project, and the Blue Line (Bang Sue-Tha Phra) is operational, with indices of 506.4 points and 498.6 points respectively, showing a land price growth rate of 15.0% YoY, with significant price increases in Phasi Charoen, Thonburi, and Bang Khae districts.
- 5th: Dark Red Line (Hua Lamphong-Mahachai) is a future project, with an index of 506.1 points and a land price growth rate of 14.9% YoY, with significant price increases in Samut Sakhon city and Bang Khun Thian district (See Table 3 and accompanying maps).
Table 3: Index of Vacant Land Prices Before Development Along Electric Train Routes with the Highest Changes Q2 2024
Source: Real Estate Information Center, Government Housing Bank
Data Compilation Method
The Real Estate Information Center, Government Housing Bank, monitors changes in vacant land prices before development in the Bangkok-Metropolitan Area, covering 6 provinces: Bangkok, Nonthaburi, Pathum Thani, Samut Prakan, Samut Sakhon, and Nakhon Pathom, using 2012 as the base year and compiling quarterly indices.
The study utilizes data on the transfer of vacant land ownership from the Land Department, selecting only vacant land without structures, with sizes starting from 200 square wah and focusing on transfers where the transferor or transferee is a "juristic person" to ensure accurate pricing for tax calculations and expenses each year.
The index calculation employs the Chain Laspeyres analysis method, using the average price per square wah weighted by the value of land ownership transfers in the Bangkok-Metropolitan Area from 2012 to 2016. Factors analyzed through multiple regression include (1) the location of the land, (2) land use zoning plans, and (3) mass transit rail routes.