REIC Reports 3% Increase in Land Price Index Before Development in Bangkok and Surrounding Areas for Q3 2023
Real Estate Information Center, Government Housing Bank has reported that the land price index before development in Bangkok and surrounding areas for Q3 2023 stands at 379.9 points, reflecting a 3.0% increase compared to the same period last year (YoY) and a 0.9% increase from the previous quarter (QoQ). The overall trend shows a gradual increase, which is slower compared to the average growth rate of 14.8% per quarter during the five years before the COVID-19 crisis (2015-2019) when compared to the same period of the previous year (YoY) and an average increase of 4.1% from the previous quarter (QoQ). This indicates that the growth rate of the land price index before the crisis was approximately five times higher than the current rate.

Dr. Vichai Wiratthakhan, Acting Director of the Real Estate Information Center, Government Housing Bank stated that the factors contributing to the slower increase in land prices are due to various negative factors, particularly the increase in the policy interest rate by the Bank of Thailand, which rose to 2.50% on September 27, 2023, marking the fifth increase since the beginning of 2023. Additionally, the cancellation of the relaxation of the LTV measures by the Bank of Thailand and the high household debt level, which exceeds 90% of GDP, are negative factors affecting purchasing power. This has led to a slowdown in residential purchasing power, causing some developers to delay plans for new project launches, which may also lead to a delay in purchasing land for development. Furthermore, the government has announced the full collection of land and building taxes in 2023, which may reduce the demand for land accumulation in the Land Bank of developers, as holding land incurs tax liabilities, increasing development costs in the future.
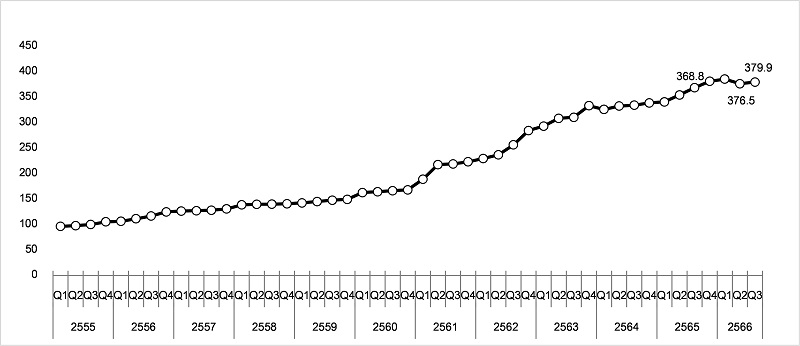
Table 1: Land Price Index Before Development in Bangkok and Surrounding Areas for Q3 2023
Source: Real Estate Information Center, Government Housing Bank
In Q3 2023, the zones with the highest land price growth rates compared to the same quarter last year (YoY) are as follows:
Rank 1: Land in Nakhon Pathom zone saw a price change of 62.5%
Rank 2: Land in Bangplee-Bangbo-Bangsaothong zone experienced a price change of 22.3%
Rank 3: Land in Samut Prakan-Phra Pradaeng-Phra Samut Chedi zone had a price change of 17.9%
Rank 4: Land in Taling Chan-Bang Kha-Phasi Charoen-Nonthaburi-Thonburi-Khlong San-Bang Phlat-Bangkok Noi-Bangkok Yai zone saw a price change of 14.9%
Rank 5: Land in inner Bangkok zone experienced a price change of 6.8% (see Table 2)
The changes in land prices reflect that land in the suburban areas of Bangkok and surrounding provinces has seen higher price changes than in the inner districts, due to plans for significant project developments in the provinces, especially in Nakhon Pathom. Additionally, land prices in suburban areas are still relatively low and can be developed into residential projects that align with the purchasing power of buyers seeking single-family homes. Data from residential surveys in the first half of 2023 indicates that these zones are experiencing a high volume of new residential project developments and are among the top areas for new sales.
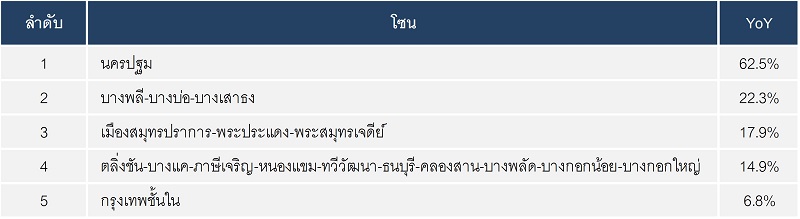
Table 2: Top 5 Zones with the Highest Price Change Rates for Q3 2023
Source: Real Estate Information Center, Government Housing Bank
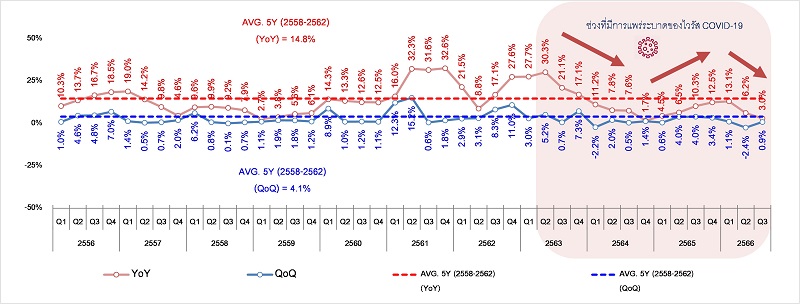
Chart 2: Growth Rate of the Land Price Index Before Development in Bangkok and Surrounding Areas
Source: Real Estate Information Center, Government Housing Bank, with 2012 as the base year
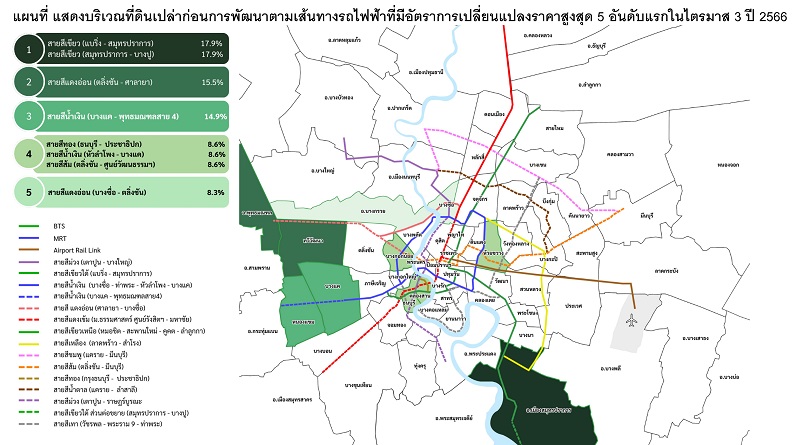
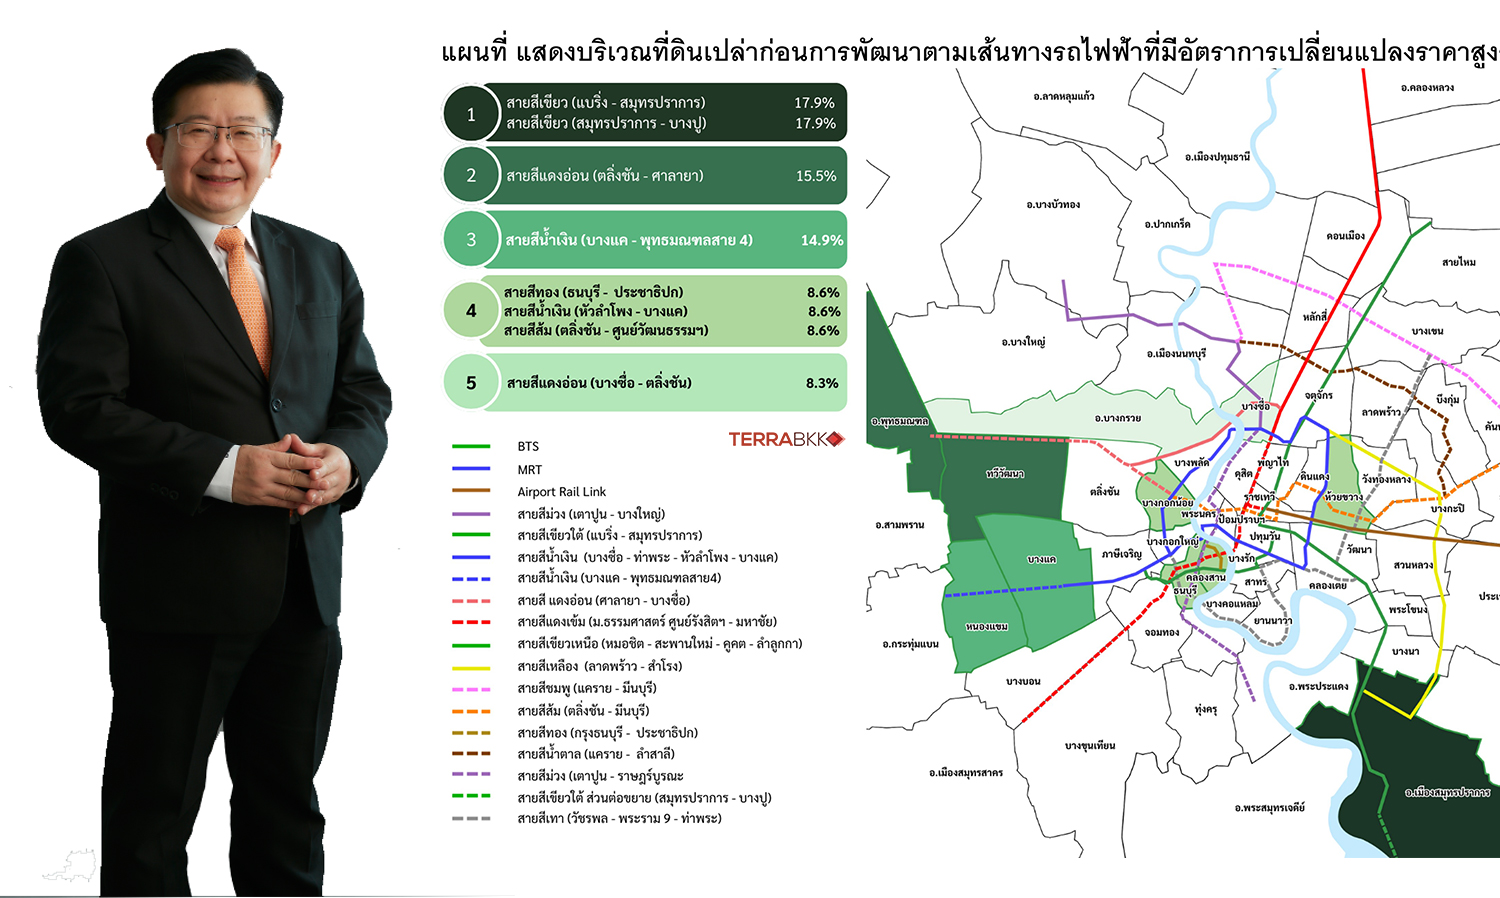
For land prices before development along the routes with electric trains in Q3 2023, the top five electric train routes with the highest land price growth rates compared to the same quarter last year (YoY) are mostly located in areas where electric train projects are already operational or planned, connecting to key commercial areas and ongoing development projects. The details are as follows:
Rank 1: Green Line (Samut Prakan-Bang Pu) and Green Line (Bearing-Samut Prakan) are future projects and those already in operation, with indices of 254.9 and 251.1 points, respectively, showing a 17.9% increase in land prices compared to the same period last year (YoY). The land prices in Samut Prakan and Phra Samut Chedi areas have seen significant increases.
Rank 2: Light Red Line (Taling Chan-Salaya) is a future project with an index of 430.0 points, showing a 15.5% increase in land prices compared to the same period last year (YoY). The land prices in Thawi Watthana, Bang Kruai, and Phutthamonthon areas have seen significant increases.
Rank 3: Blue Line (Bang Khae-Line 4) is a future project with an index of 428.8 points, showing a 14.9% increase in land prices compared to the same period last year (YoY). The land prices in Nong Kham and Bang Khae areas have seen significant increases.
Rank 4: Blue Line (Hua Lamphong-Bang Khae), Gold Line (Thonburi-Phachathipok) are operational projects, and Orange Line (Taling Chan-Cultural Center) is a future project, with indices of 502.4, 495.2, and 487.6 points, respectively, showing an 8.6% increase in land prices compared to the same period last year (YoY). The land prices in Bangkok Noi, Thonburi, Khlong San, and Huai Khwang areas have seen significant increases.
Rank 5: Light Red Line (Bang Sue-Taling Chan) is an operational project with an index of 479.8 points, showing an 8.3% increase in land prices compared to the same period last year (YoY). The land prices in Bang Sue and Bang Kruai areas have seen significant increases (see Table 3 and accompanying map).