Short Term Analyze Property Index on July,30 2014
จากเมื่อวันที่ 27 ก.ค.57 ทาง TerraBKK Research ทำการวิเคราะทั้งกราฟรายสัปดาห์และรายวันเอาไว้แล้ว แต่เนื่องจากวันที่ 29 ก.ค.2557 มีการเปลี่ยนแปลงของตลาดหุ้นที่น่าสนใจ (ดัชนี SET INDEX ลดลง -17.58 จุด) ทาง TerraBKK Research จึงขออัพเดทกราฟรายวันของวันที่ 29 ก.ค.2557 เพื่อเป็นแนวทางในการตัดสินใจลงทุนต่อไป
SET INDEX![]()
ดัชนี SET INDEX ปิดเมื่อวันอังคารที่ผ่านมาที่ 1520.55 หลุด Tenkan ลงมาพอสมควร ระดับ RSI อยู่ที่ 55.89 ซึ่งยังอยู่ในโซนขาขึ้นอยู่ แต่แนวโน้มของขาขึ้นเริ่มอ่อนตัวสังเกตได้จากค่าของ ADX ที่ลดลงต่อเนื่องแต่ยังมีค่ามากกว่า 30 ถือว่ายังเป็นขาขึ้นที่แข็งแกร่งอยู่ TerraBKK Research มองว่า การพักตัวของตลาดเป็นการพักเพื่อไปต่อ อาจจะกลับเข้าซื้อบริเวณ Kijun ที่ 1500 เป็นระดับที่น่ากลับเข้าสะสมมาก
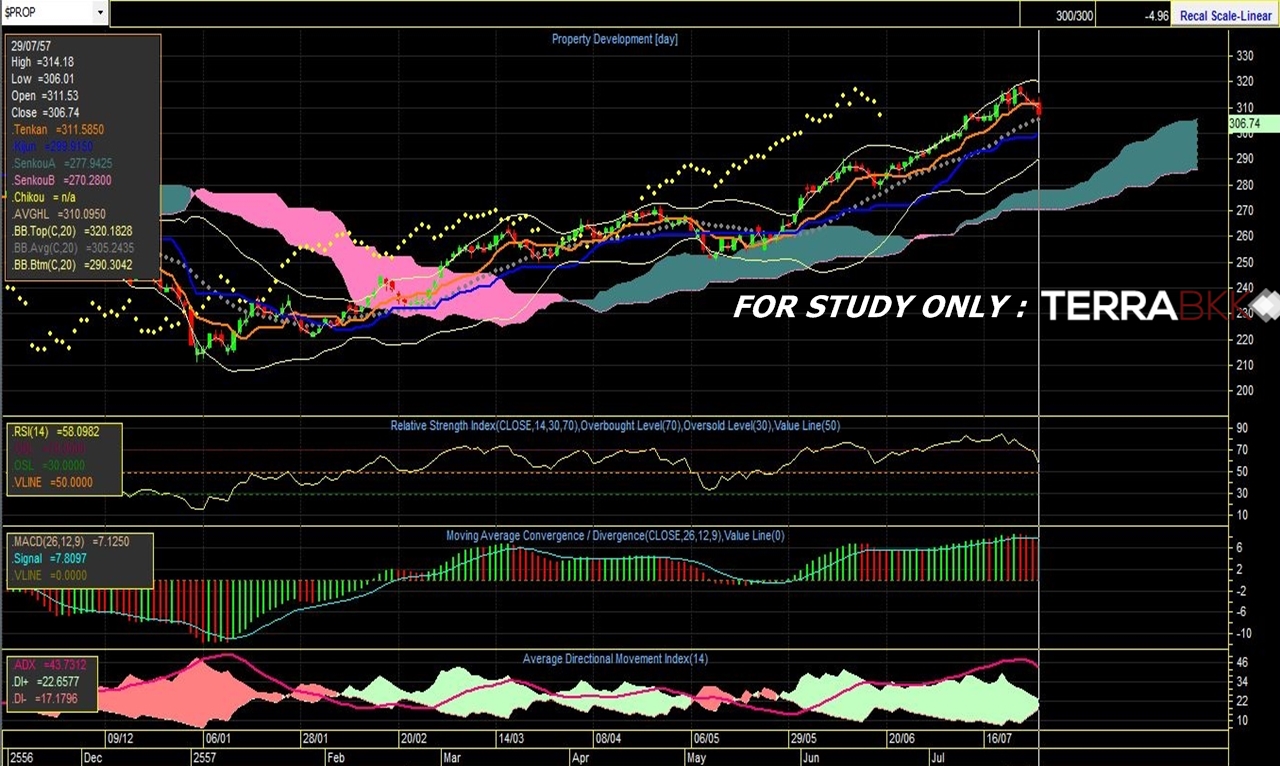
Sector : Property Development![]()
เมื่อภาพรวมตลาดมองเป็นภาพพักตัวในระยะสั้น กลุ่มพัฒนาอสังหาริมทรัพย์ก็ได้รับผลกระทบจากแรงขายของตลาดด้วยทำให้วันที่ 29 ก.ค.57 ดัชนีภาคอสังหาริมทรัพย์ปรับตัวลงมาปิดที่ 306.74 จุด หลุดเส้น Tenkan ลงมาอย่างมีนัยสำคัญ RSI ยังอยู่ในโซนของขาขึ้น TerraBKK Research มองว่าการลงครั้งนี้ยังเป็นการลงเพื่อไปต่ออยู่ แต่ดัชนีมีความเป็นไปได้สูงที่จะมาพักตัวบริเวณ 300 จุด (Kijin) ซึ่งบริเวณตรงนี้น่าลงทุน แต่ถ้าหลุด 300 ลงไปอาจจะต้องชะลอการซื้อแล้วถือเงินสดให้มากเพราะอาจจะเป็นการกลับตัวสู่แนวโน้มขาลงครั้งสำคัญก็ได้
Indicator definition by investopedia. Moving Average Convergence Divergence – MACD : “A trend-following momentum indicator that shows the relationship between two moving averages of prices. The MACD is calculated by subtracting the 26-day exponential moving average (EMA) from the 12-day EMA. A nine-day EMA of the MACD, called the "signal line", is then plotted on top of the MACD, functioning as a trigger for buy and sell signals.” Relative Strength Index - RSI : “A technical momentum indicator that compares the magnitude of recent gains to recent losses in an attempt to determine overbought and oversold conditions of an asset.” Average Directional Index – ADX : “An indicator used in technical analysis as an objective value for the strength of trend. ADX is non-directional so it will quantify a trend's strength regardless of whether it is up or down. ADX is usually plotted in a chart window along with two lines known as the DMI (Directional Movement Indicators). ADX is derived from the relationship of the DMI lines.”