Housing Market Situation in EEC Q2 2025 and First Half of 2025
The Real Estate Information Center (REIC) of the Government Housing Bank (GHB) has conducted an analysis on “The Housing Market Situation in EEC in Q2 2025 and the First Half of 2025.” It found that the overall housing market in the EEC has slowed down in both demand and supply compared to the same period last year (YoY), with a decrease in both the number of units and value of property transfers. However, when compared quarter-on-quarter (QoQ), there has been some recovery driven by government measures, such as the reduction of transfer and mortgage fees to 0.01% and the relaxation of loan-to-value (LTV) ratios across all price levels. Regionally, Rayong province remains prominent as the only province where property transfers have expanded, reflecting the driving force from the industrial sector and labor demand. Meanwhile, the supply side, including land allocation permits and overall construction areas, has continued to decline, particularly in Chonburi province, which is the main market area. Nevertheless, Rayong province continues to see significant growth in construction areas, reinforcing its role as a key investment and employment hub in the eastern region. The details are as follows:
In Q2 2025, the housing market in the EEC showed that in terms of demand, property transfers decreased in both the number of units and value, with declines of -7.4% and -8.4%, respectively, compared to the same period last year (YoY). However, compared to the previous quarter (QoQ), property transfers received a positive boost from government economic stimulus measures, including the reduction of transfer and mortgage fees to 0.01% for residences priced up to 7 million baht, as well as the relaxation of housing loan measures (LTV) by the Bank of Thailand, which will take effect from Q2 2025 onwards, resulting in an increase in both the number of units and value from Q1 2025. In terms of supply, the number of land allocation permits decreased by -7.7% and the number of units decreased by -10.3% compared to the same period last year (YoY). The area permitted for residential construction decreased by -0.3%, with a significant drop in the area permitted for condominium construction by -23.7%, while the area permitted for horizontal housing increased by 1.7% compared to the same period last year (YoY).
In the first half of 2025, the housing market in the EEC showed that in terms of demand, property transfers decreased by -6.8% in the number of units and -8.3% in value compared to the same period in 2024. When considering each area, Rayong province was the only province in the EEC that experienced growth in both the number of units and the value of property transfers, with increases of 4.1% and 3.7%, respectively. This resulted in a supply of permitted residential construction areas decreasing by -11.6%, divided into approximately 1,478,692 square meters for horizontal housing, a decrease of -11.0%, and approximately 61,212 square meters for condominiums, a decrease of -23.0%. It was found that Rayong province had an increase in permitted residential construction areas by 19.3%, which may reflect the housing demand of workers in the industrial estate area. Meanwhile, the number of land allocation permits decreased by -22.9% and the number of units decreased by -33.6% compared to the same period in 2024, with townhouses accounting for the largest proportion at 40.2%, and Chonburi province having the highest number of land allocation permits, accounting for 44.3% of all land allocation permits.
The overall demand and supply situation in the housing market in the EEC in Q2 2025 and the first half of 2025 can be summarized as follows:
1. Housing Supply Situation
1.1 Land Allocation Permits
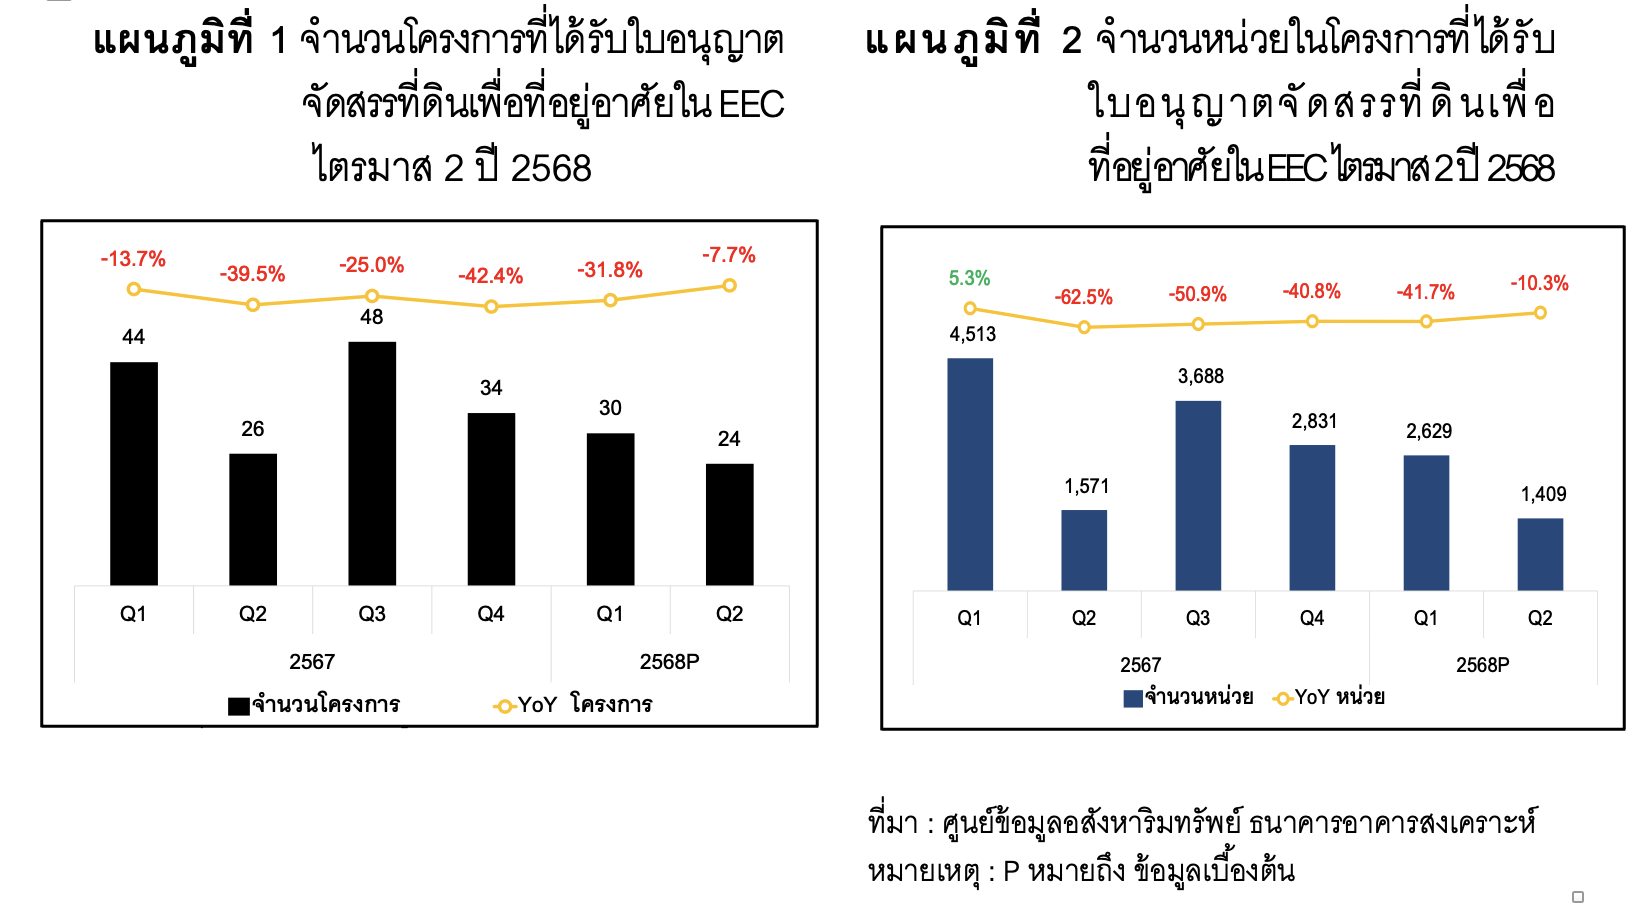
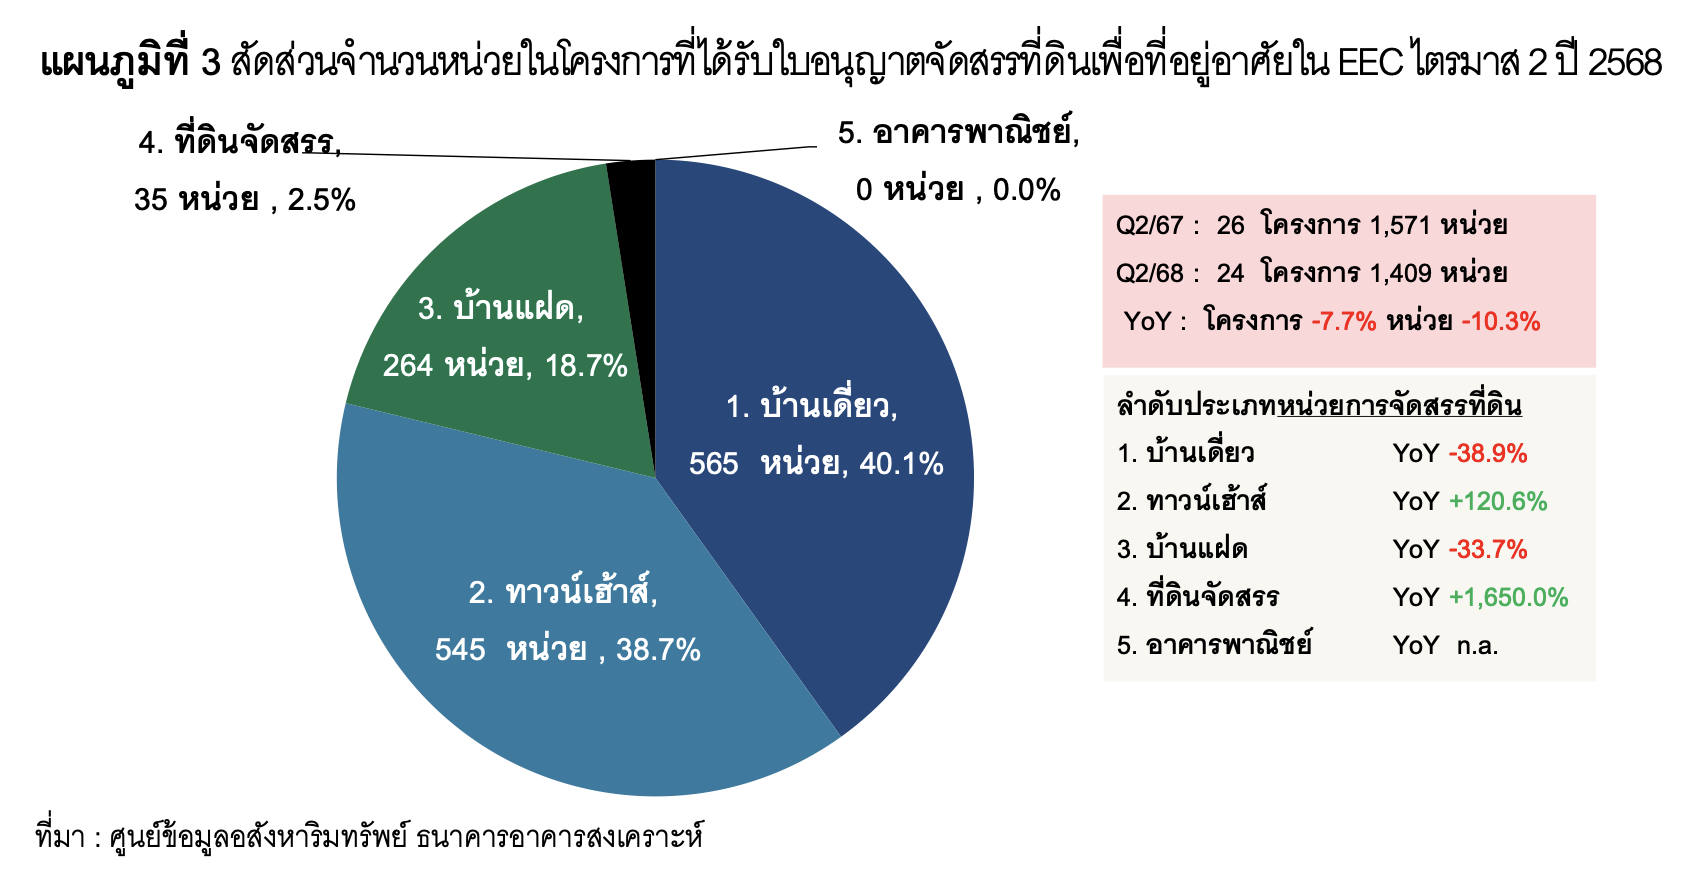
In Q2 2025, there were 24 residential projects that received land allocation permits from the Land Department, a decrease of -7.7%, with a total of 1,409 units, a decrease of -10.3% compared to the same period last year (YoY). In Q2 2025, the majority of land allocation permits were for single houses, totaling 565 units, accounting for 40.1% of all land allocation permits, followed by townhouses with 545 units, accounting for 38.7%, and duplexes with 264 units, accounting for 18.7%. The remaining permits were for land allocations, but no commercial buildings were found.
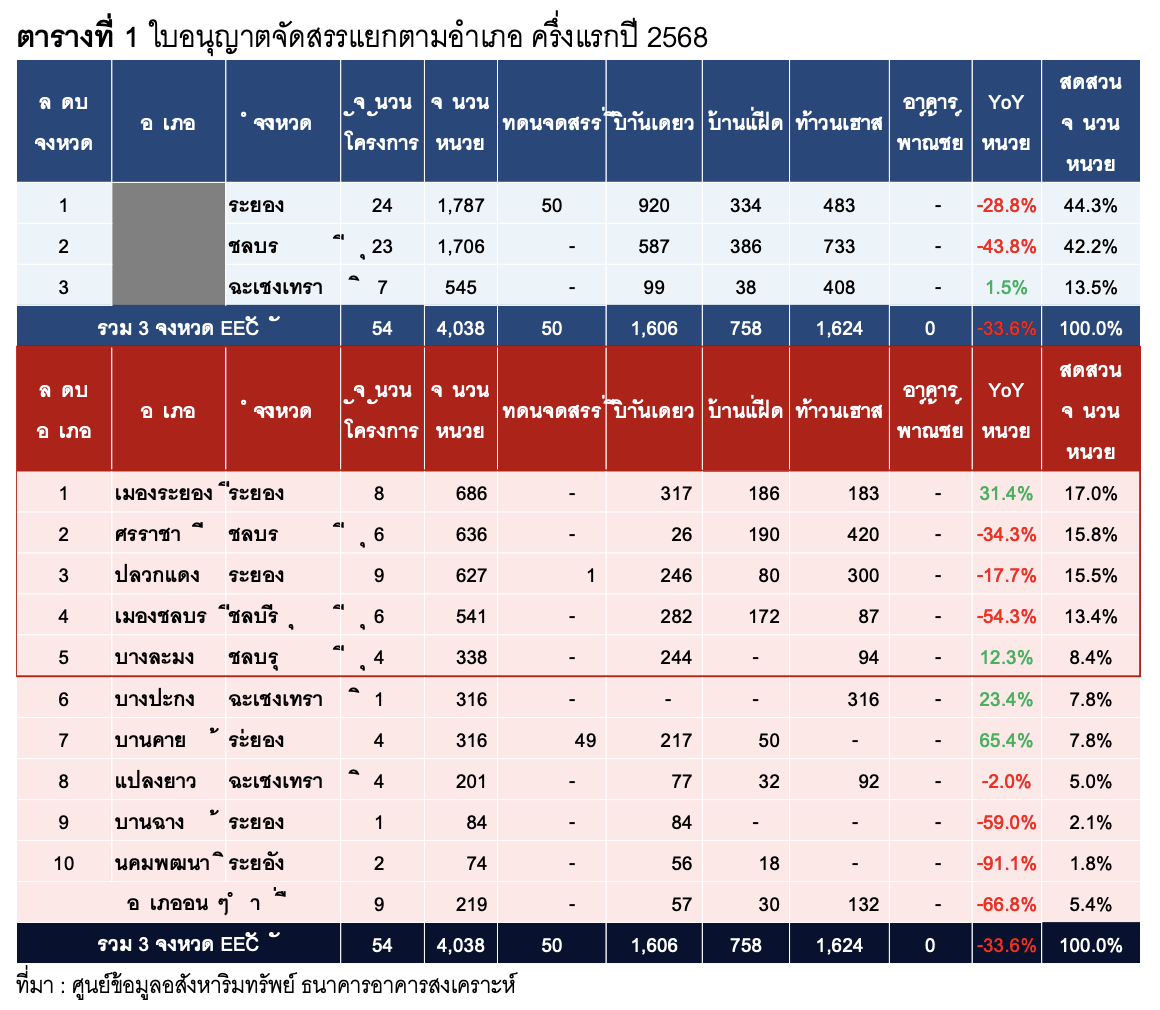
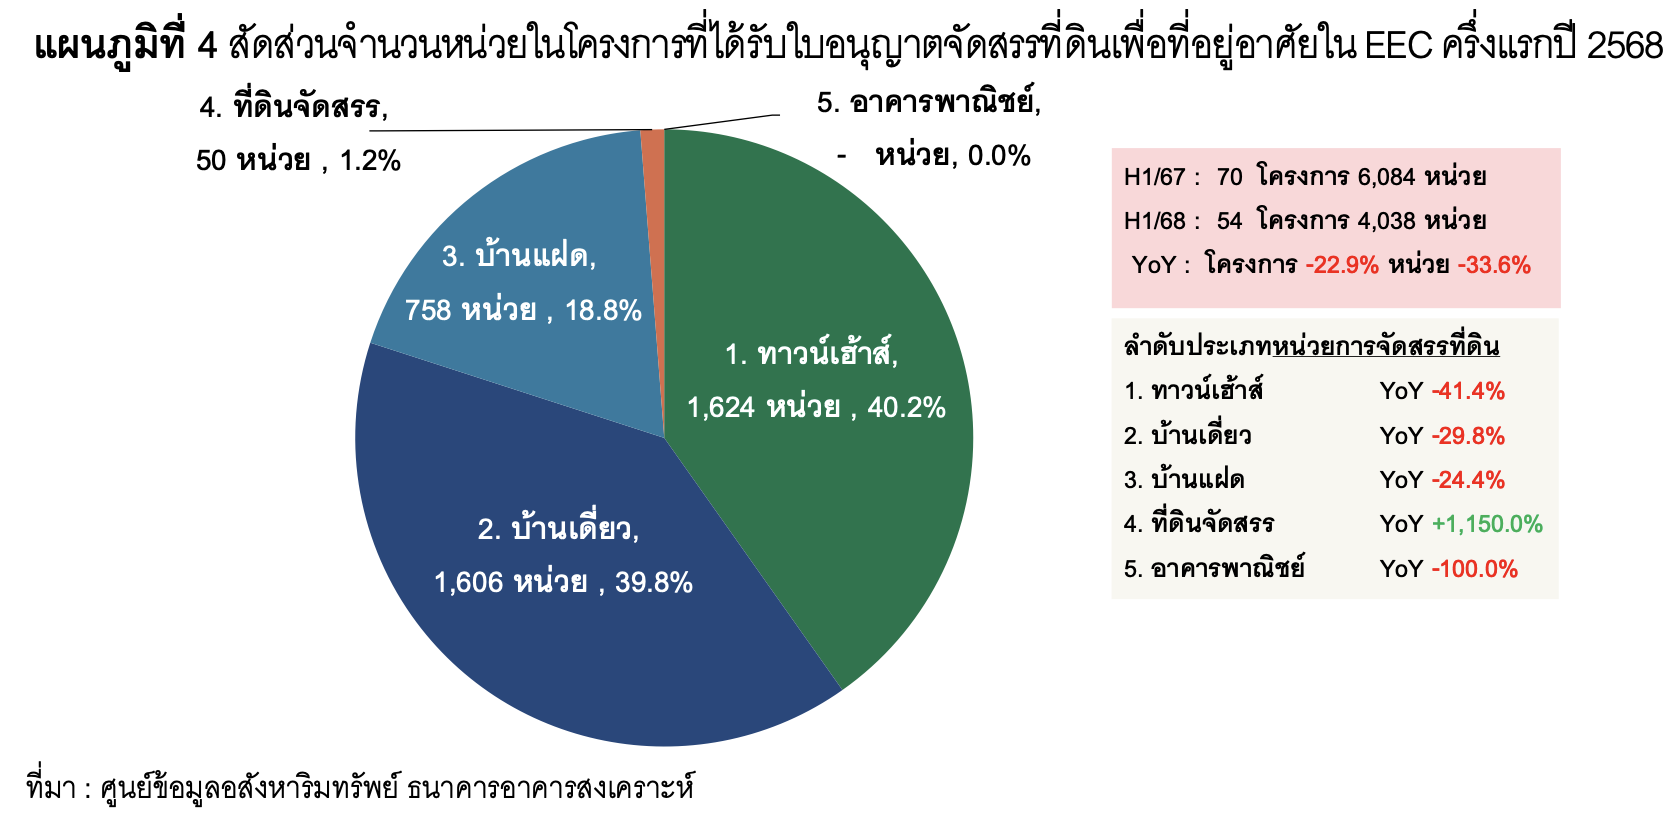
For the first half of 2025, there were 54 land allocation permits from the Land Department for 4,038 units, with the number of projects decreasing by -22.9% and the number of units decreasing by -33.6% compared to the same period in 2024, which had 70 projects and 6,084 units. The most common land allocation permits were for townhouses, totaling 1,624 units, accounting for 40.2% of all land allocation permits, followed by single houses with 1,606 units, accounting for 39.8%, and duplexes with 758 units, accounting for 18.8%. The remaining permits were for land allocations, but no commercial buildings were found.
When considering by province in the EEC for the first half of 2025, the provinces with the highest number of land allocation permits are as follows:
1st Place: Rayong Province with 1,787 units, accounting for 44.3% of all land allocation permits, and a decrease of -28.8% compared to the same period last year (YoY), with the majority being single house permits totaling 920 units, a decrease of -26.6%, followed by townhouses with 483 units, a decrease of -18.5%, and duplexes with 334 units, a decrease of -49.5%.
2nd Place: Chonburi Province with 1,706 units, accounting for 42.2% of all land allocation permits, and a decrease of -43.8% compared to the same period last year (YoY), with the majority being townhouse permits totaling 733 units, a decrease of -60.2%, followed by single houses with 587 units, a decrease of -32.4%, and duplexes with 386 units, an increase of 27.8%.
3rd Place: Chachoengsao Province with 545 units, accounting for 13.5% of all land allocation permits, and an increase of 1.5% compared to the same period last year (YoY), with the majority being townhouse permits totaling 408 units, an increase of 22.9%, followed by single houses with 99 units, a decrease of -40.4%, and duplexes with 38 units.
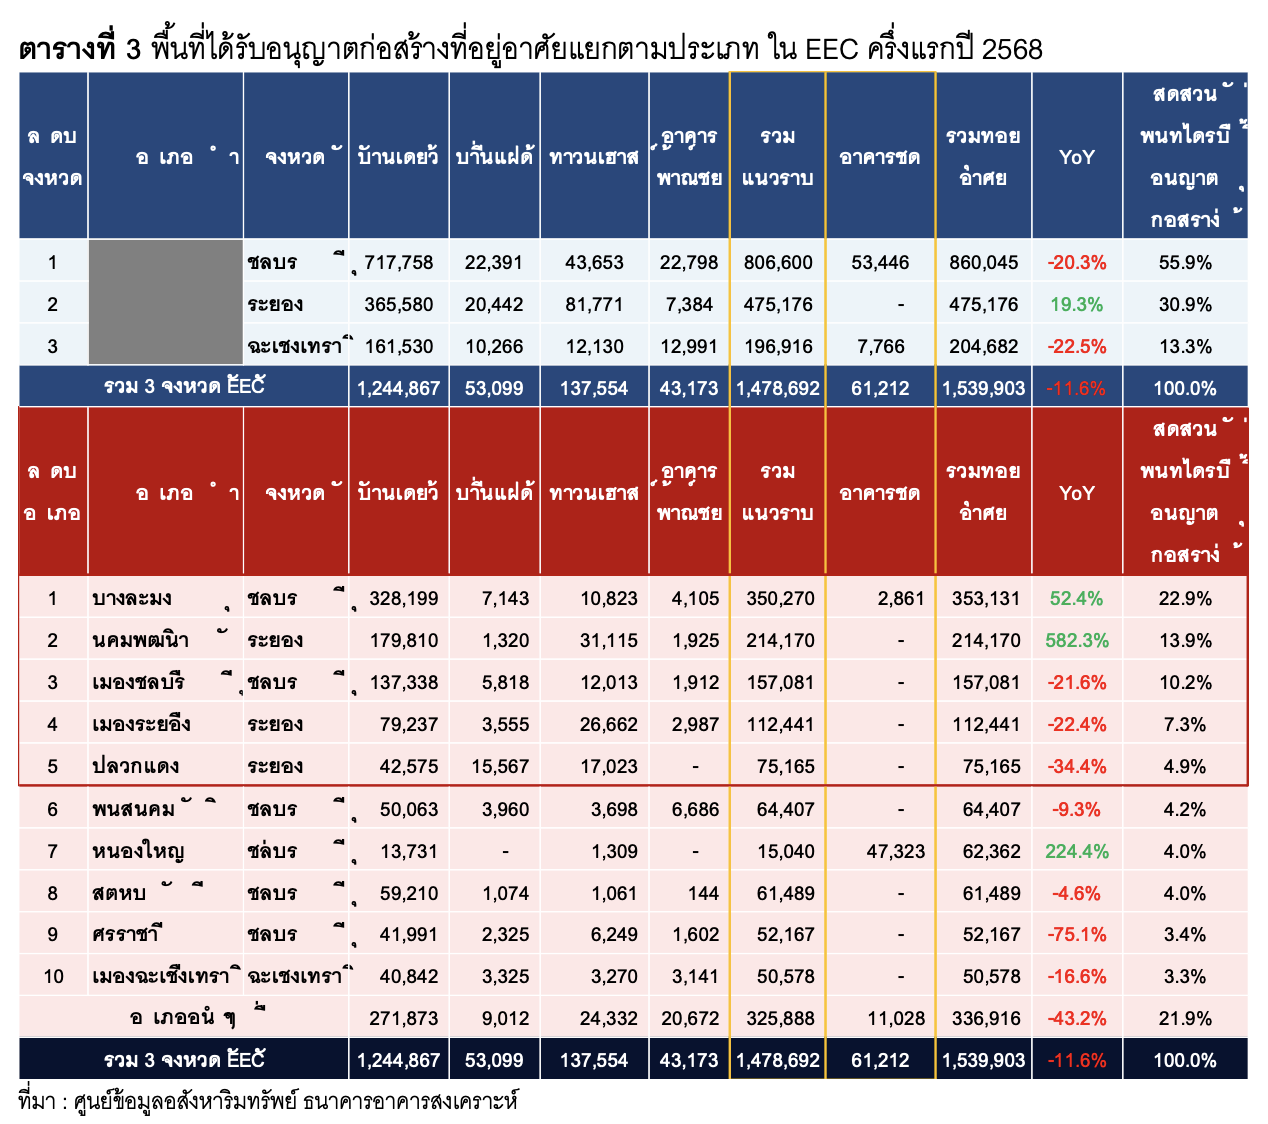
1.2 Permitted Residential Construction Areas
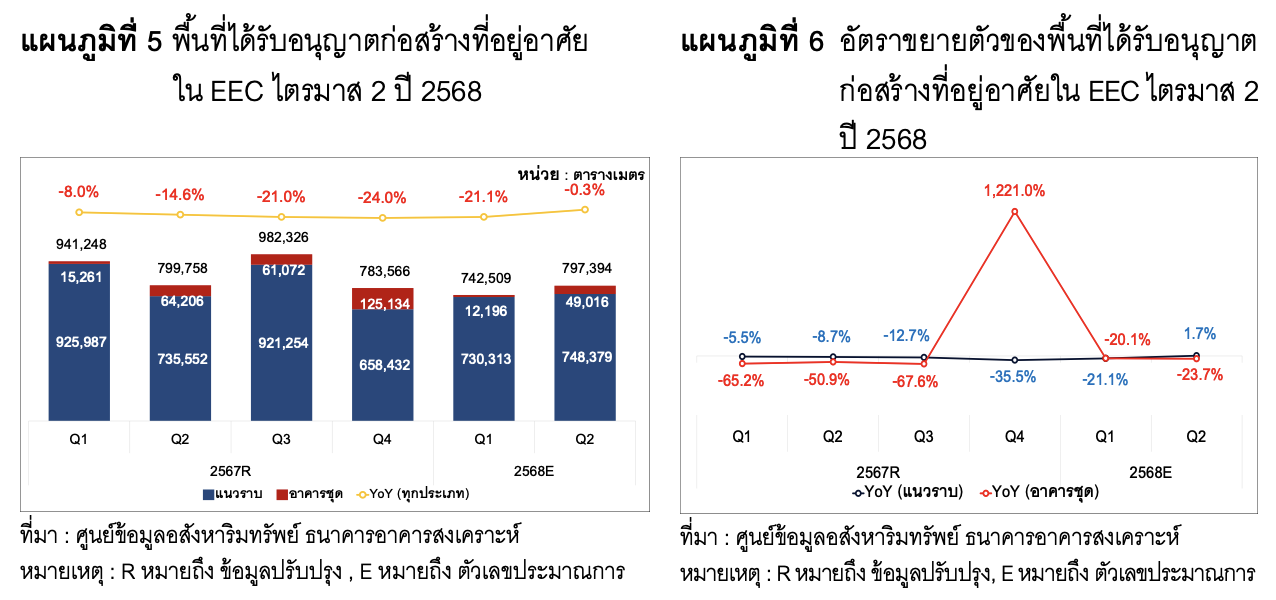
In Q2 2025, the permitted residential construction area in the EEC, including self-built residences and those in development projects and condominiums, totaled 797,394 square meters, divided into permitted construction areas for horizontal housing of 748,379 square meters, an increase of 1.7%, and condominiums of 49,016 square meters, a decrease of -23.7% compared to the same period last year (YoY).
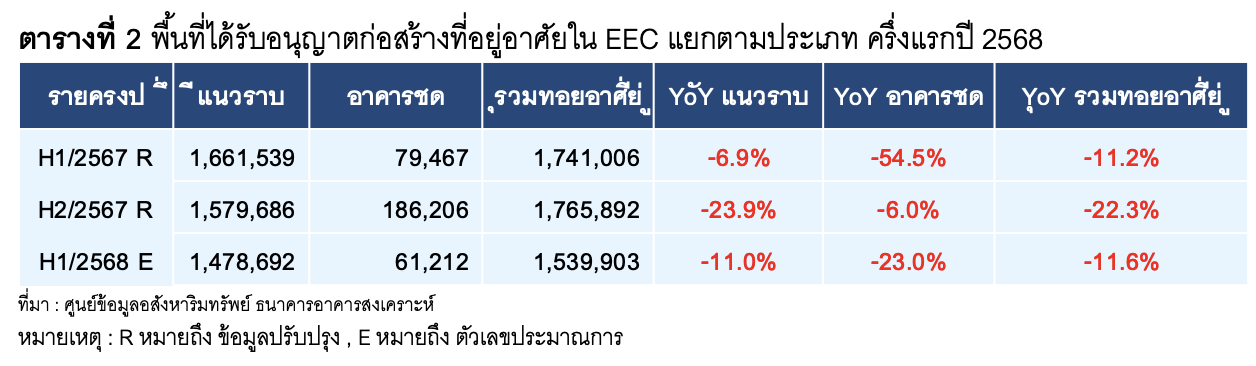
For the first half of 2025 (January - June), the permitted residential construction area in the EEC, including self-built houses, houses in development projects, and condominiums, totaled approximately 1,539,903 square meters, a decrease of -11.6% compared to the same period in 2024, divided into permitted construction areas for horizontal housing of approximately 1,478,692 square meters, a decrease of -11.0%, and condominiums of approximately 61,212 square meters, a decrease of -23.0% compared to the same period in 2024.
When considering by province in the EEC for the first half of 2025, the provinces with the highest permitted residential construction areas are as follows:
1st Place: Chonburi Province with an area of 860,045 square meters, accounting for 55.9% of the total permitted residential construction area, with a decrease of -20.3% compared to the same period in 2024, divided into horizontal housing of 806,600 square meters, with the majority being single houses totaling 717,758 square meters, an increase of 8.6%, followed by townhouses of 43,653 square meters, a decrease of -76.0%, and commercial buildings of 22,798 square meters, a decrease of -60.3% compared to the same period in 2024. The condominium area was 53,446 square meters, a decrease of -18.4% compared to the same period in 2024.
2nd Place: Rayong Province with an area of 475,176 square meters, accounting for 30.9% of the total permitted residential construction area, with an increase of 19.3% compared to the same period in 2024, divided into horizontal housing of 475,176 square meters, with the majority being single houses totaling 365,580 square meters, an increase of 22.8%, followed by townhouses of 81,771 square meters, an increase of 20.7%, and duplexes of 20,442 square meters, an increase of 34.9% compared to the same period in 2024. No condominium construction areas were found in the first half of 2025.
3rd Place: Chachoengsao Province with an area of 204,682 square meters, accounting for 13.3% of the total permitted residential construction area, with a decrease of -22.5% compared to the same period in 2024, divided into horizontal housing of 196,916 square meters, with the majority being single houses totaling 161,530 square meters, a decrease of -20.9%, followed by commercial buildings of 12,991 square meters, a decrease of -33.2%, and townhouses of 12,130 square meters, a decrease of -58.0% compared to the same period in 2024. The condominium area increased by 7,766 square meters compared to the same period in 2024.
2. Housing Demand
2.1 Property Transfers
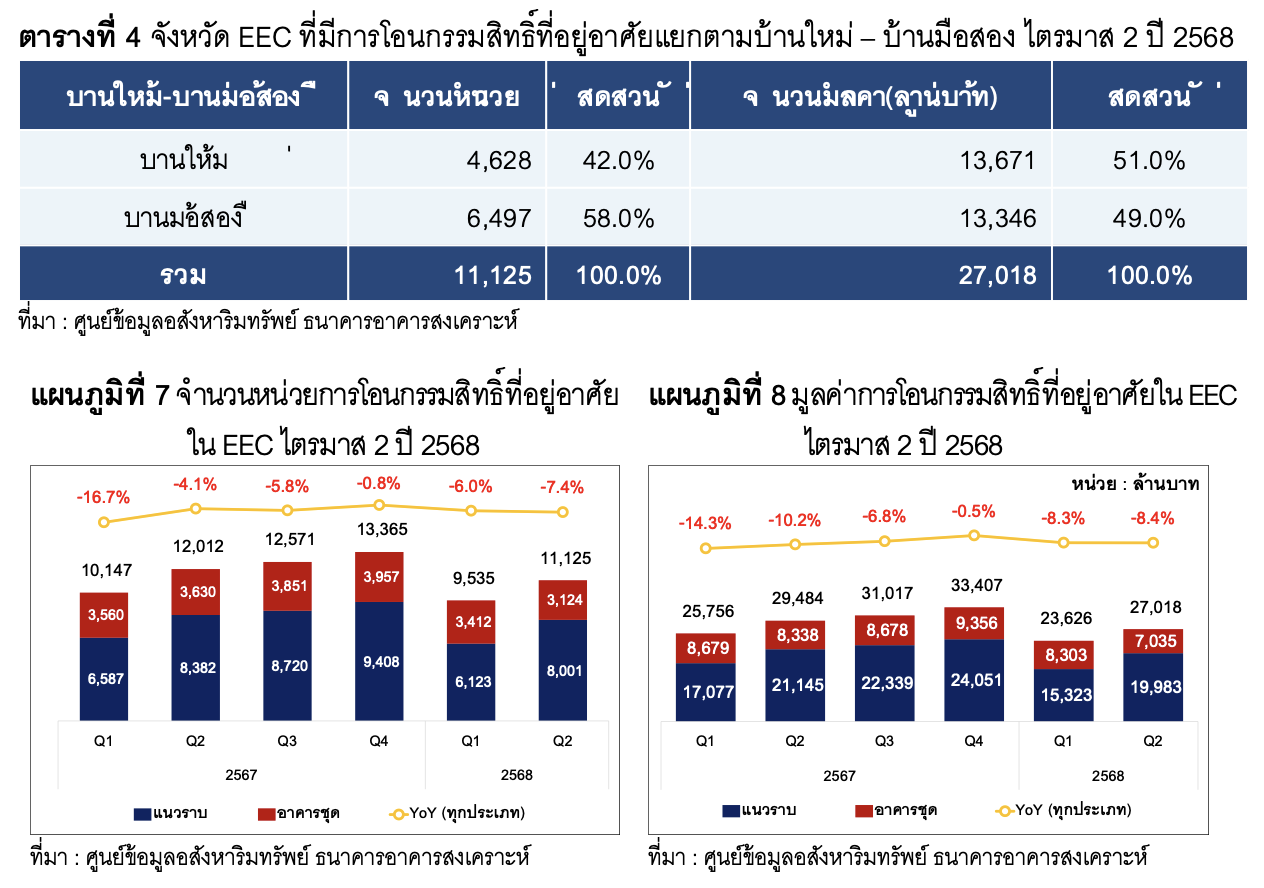
In Q2 2025, there were 11,125 property transfers in the EEC, valued at 27,018 million baht, representing decreases in both the number of units and value by -7.4% and -8.4%, respectively, compared to the same period last year (YoY), which had 12,012 units and a value of 29,484 million baht. The majority of property transfers were for horizontal housing, totaling 8,001 units, accounting for 71.9% of all property transfers, a decrease of -4.5%, with a transfer value of 19,983 million baht, a decrease of -5.5% compared to the same period last year (YoY), which had 8,382 units and a value of 21,145 million baht. For condominiums, there were 3,124 units, accounting for 28.1%, a decrease of -13.9%, with a value of 7,035 million baht, a decrease of -15.6% compared to the same period last year (YoY), which had 3,630 units and a value of 8,338 million baht.
For new property transfers, there were 4,628 units, and for second-hand properties, there were 6,497 units, resulting in a ratio of new property transfers to second-hand properties in Q2 2025 of 42:58. The transfer value of new properties was 13,671 million baht, while the transfer value of second-hand properties was 13,346 million baht, resulting in a ratio of value of new properties to second-hand properties of 51:49.
For the first half of 2025 (January - June), there were 20,660 property transfers in the EEC, valued at 50,644 million baht, representing decreases in both the number of units and value by -6.8% and -8.3%, respectively, compared to the same period in 2024, which had 22,159 units and a value of 55,240 million baht.
In the first half of 2025, the majority of property transfers were for horizontal housing, totaling 14,124 units, accounting for 68.4% of all property transfers, a decrease of -5.6%, with a value decrease of -7.6%, amounting to 35,306 million baht compared to the same period in 2024, which had 14,969 units and a value of 38,223 million baht. For condominiums, there were 6,536 units, accounting for 31.6% of all property transfers, with a value of 15,338 million baht, representing decreases in both the number of units and value by -9.1% and -9.9%, respectively, compared to the same period in 2024, which had 7,190 units and a value of 17,017 million baht.
When considering by province for the highest number of property transfers by value, the ranking is as follows:
1st Place: Chonburi Province with 13,840 units transferred, a decrease of -9.3%, and a value of 36,069 million baht, a decrease of -10.1% compared to the same period in 2024, which had 15,265 units and a value of 40,136 million baht. The majority of transfers were for horizontal housing, totaling 7,961 units, with a value of 21,726 million baht, of which the highest number of transfers were townhouses, totaling 3,326 units, with a value of 6,029 million baht. For condominiums, there were 5,879 units transferred, with a value of 14,342 million baht.
2nd Place: Rayong Province with 5,129 units, an increase of 4.1%, and a value of 10,944 million baht, an increase of 3.7% compared to the same period in 2024, which had 4,929 units and a value of 10,557 million baht. The majority of transfers were for horizontal housing, totaling 4,609 units, with a value of 10,128 million baht, of which the highest number of transfers were single houses, totaling 2,201 units, with a value of 5,686 million baht. For condominiums, there were 520 units transferred, with a value of 816 million baht.
3rd Place: Chachoengsao Province with 1,691 units, a decrease of -13.9%, and a value of 3,631 million baht, a decrease of -20.1% compared to the same period in 2024, which had 1,965 units and a value of 4,546 million baht. The majority of transfers were for horizontal housing, totaling 1,554 units, with a value of 3,451 million baht, of which the highest number of transfers were single houses, totaling 666 units, with a value of 1,687 million baht. For condominiums, there were 137 units transferred, with a value of 180 million baht.
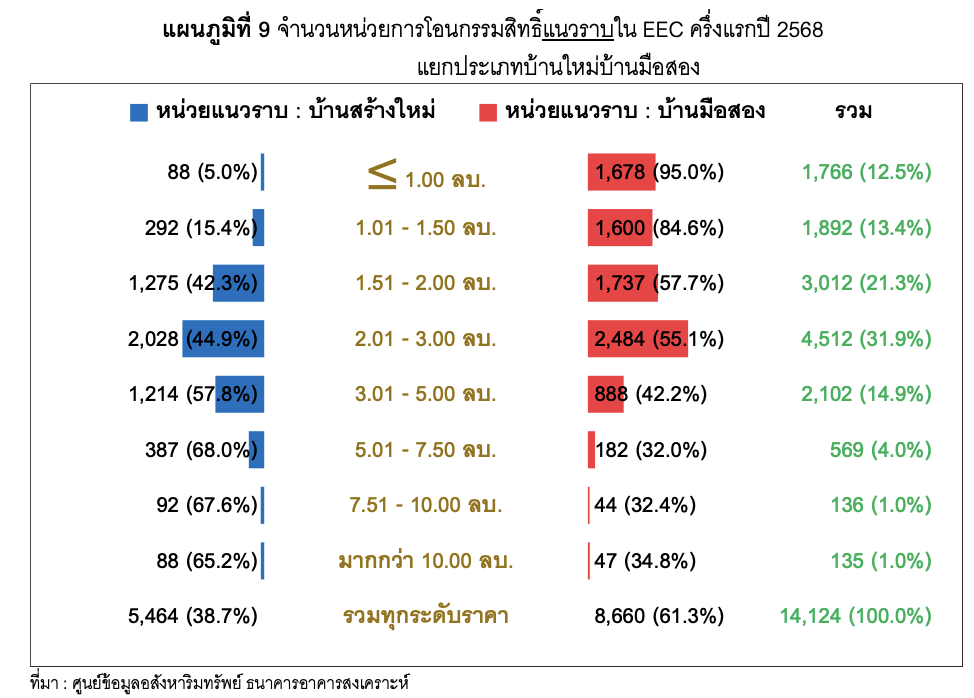
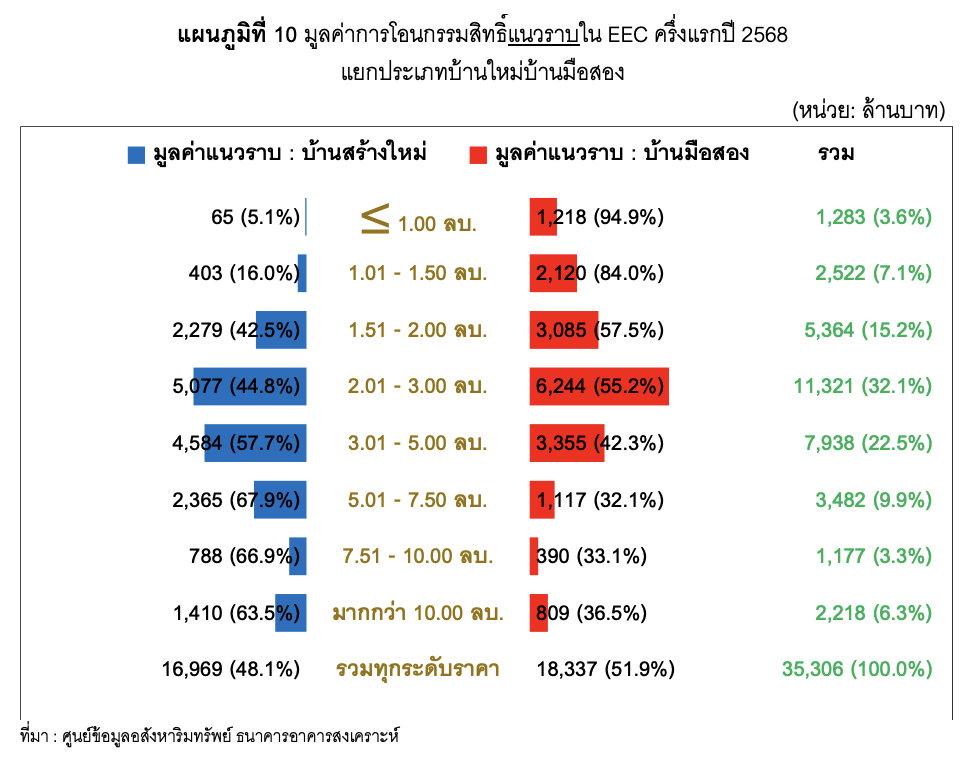
For horizontal property transfers in the first half of 2025, it was found that in the EEC, there were 5,464 new houses transferred (or new houses transferred from legal entities) with a value of 16,969 million baht, and 8,660 second-hand houses (second-hand houses transferred from individuals) with a value of 18,337 million baht, resulting in a ratio of new house transfers to second-hand houses in the first half of 2025 of 39:61. The transfer value of new houses compared to second-hand houses had a ratio of 48:52. When classified by price level, it was found that the majority of transfers were in the price range of 2.01 – 3.00 million baht, totaling 4,512 units, accounting for 31.9% of all horizontal property transfers, divided into new house transfers of 2,028 units and second-hand houses of 2,484 units. The next highest price range was 1.51 – 2.00 million baht, with 3,012 units, accounting for 21.3%, divided into new house transfers of 1,275 units and second-hand houses of 1,737 units, followed by the price range of 3.01 – 5.00 million baht, with 2,102 units, accounting for 14.9%, divided into new house transfers of 1,214 units and second-hand houses of 888 units. When considering the transfer value, it was found that the majority of transfers were in the price range of 2.01 – 3.00 million baht, totaling 11,321 million baht, accounting for 32.1% of the total transfer value of horizontal properties, divided into new house transfer value of 5,077 million baht and second-hand house transfer value of 6,244 million baht.
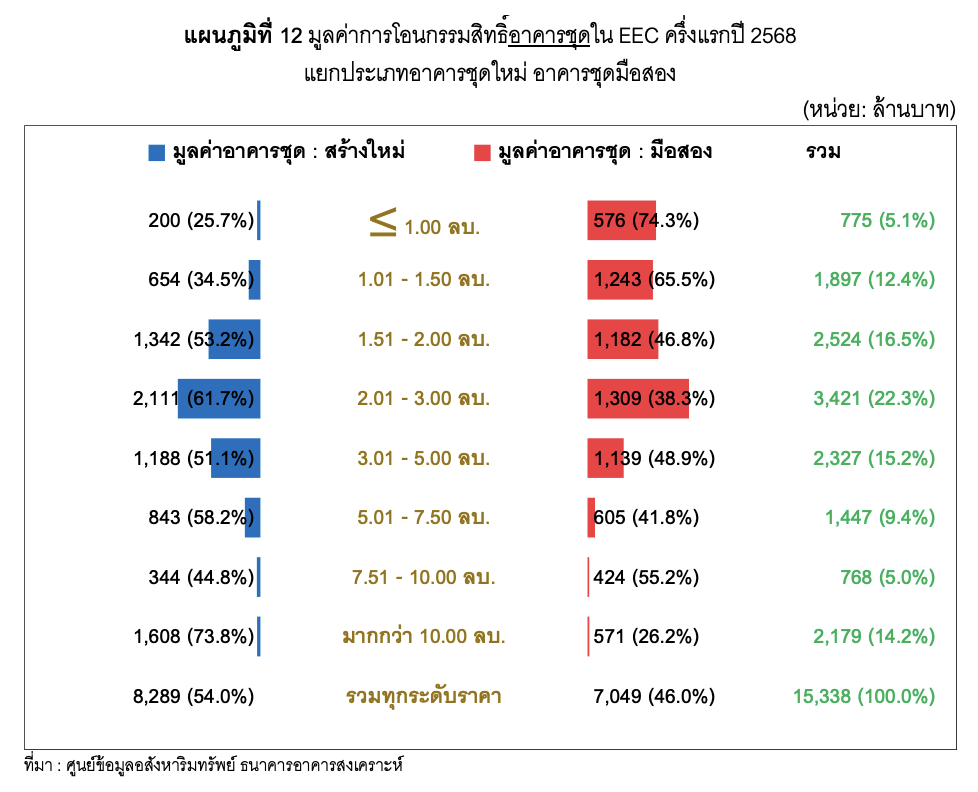
For condominium transfers in the first half of 2025, it was found that in the EEC, there were 2,995 new condominiums transferred (or new condominiums transferred from legal entities) with a value of 8,289 million baht, and 3,541 second-hand condominiums (second-hand condominiums transferred from individuals) with a value of 7,049 million baht, resulting in a ratio of new condominium transfers to second-hand condominiums in the first half of 2025 of 46:54, while the transfer value of new condominiums compared to second-hand condominiums had a ratio of 54:46.
When classified by price level, it was found that the majority of transfers were in the price range of 1.01 – 1.50 million baht, totaling 1,474 units, accounting for 22.6%, divided into new condominium transfers of 503 units and second-hand condominiums of 971 units. The next highest price range was 1.51 – 2.00 million baht, with 1,443 units, accounting for 22.1% of all condominium transfers, divided into new condominium transfers of 764 units and second-hand condominiums of 679 units, followed by the price range of 2.01 – 3.00 million baht, with 1,412 units, accounting for 21.6%, divided into new condominium transfers of 880 units and second-hand condominiums of 532 units. When considering the transfer value, it was found that the majority of transfers were in the price range of 2.01 – 3.00 million baht, totaling 3,421 million baht, accounting for 22.3% of the total transfer value of condominiums, divided into new condominium transfer value of 2,111 million baht and second-hand condominium transfer value of 1,309 million baht.
----------------------------------
Copyright Notice
For the use or publication of any information contained in this report, whether in part or in full, please reference the “Real Estate Information Center” as the source of the information.
Disclaimer
The statistical data and any writings in this report have been obtained from reliable sources or processed from reliable data. The Real Estate Information Center has verified the information to a certain extent, but it cannot guarantee the accuracy or truthfulness and cannot be held liable for any damages arising from the use of the information. Users should exercise their own judgment and verify as appropriate.