Ministry of Finance's Economic Situation Report for the Week Ending April 30, 2021
The Ministry of Finance's Economic Policy Office reports the economic indicators for the week ending April 30, 2021, as follows:
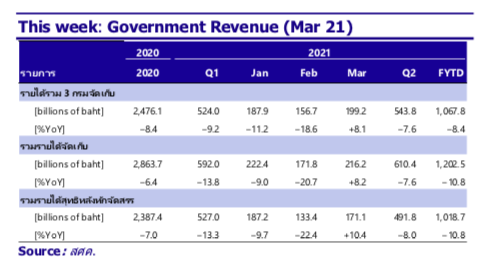
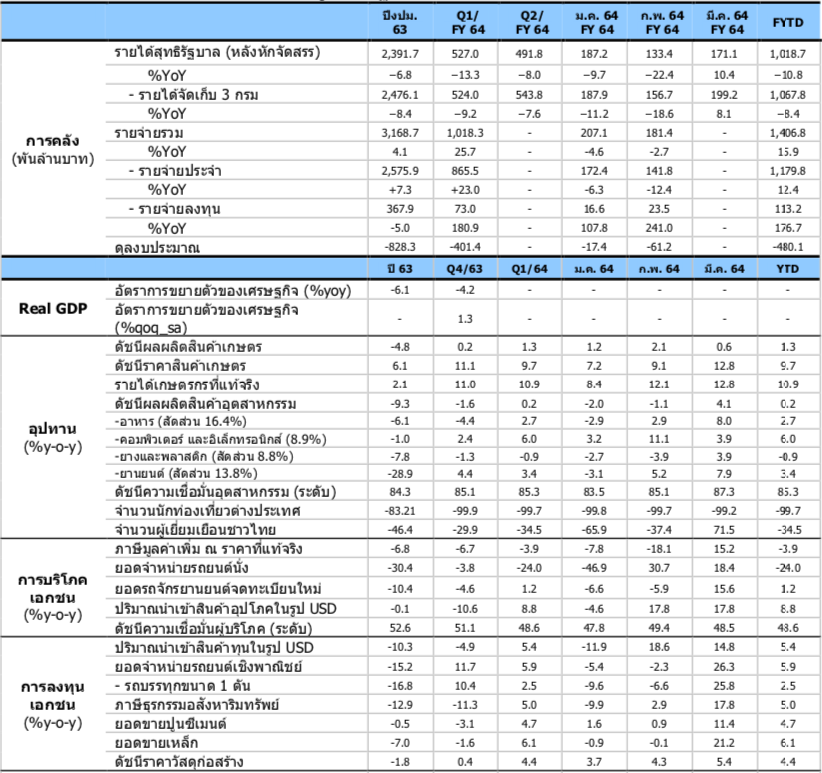
1. The government collected net revenue (after allocation to local administrations) in March 2021, growing by 10.4% year-on-year.
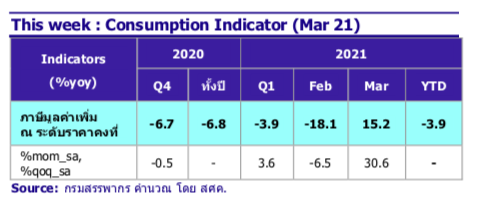
2. The value-added tax collected by the government at constant prices in March 2021 grew by 15.2% year-on-year.
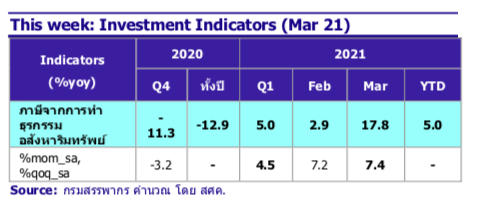
3. Tax from real estate transactions in March 2021 grew by 17.8% year-on-year.
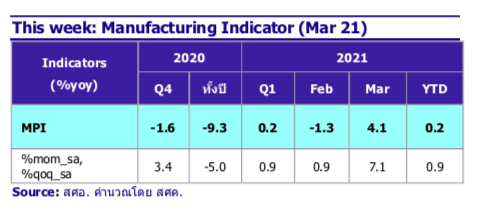
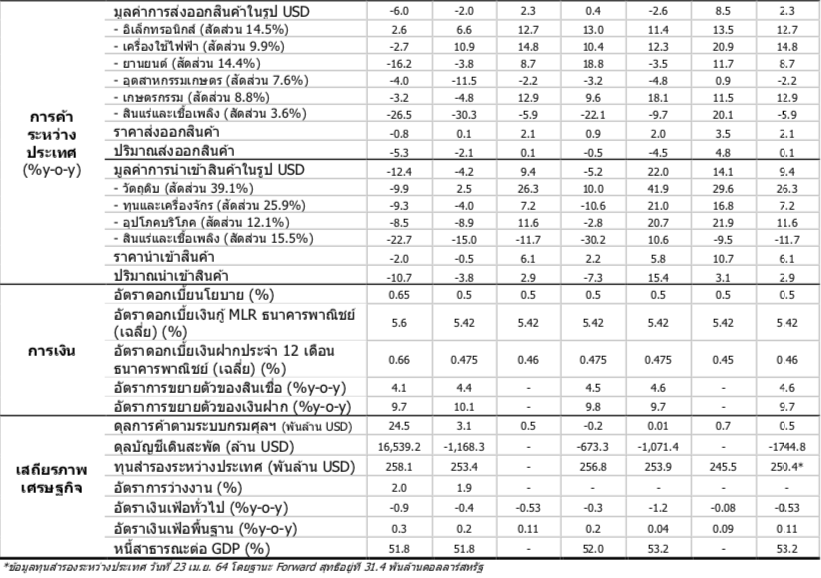
4. The Manufacturing Production Index (MPI) in March 2021 grew by 4.1% year-on-year.
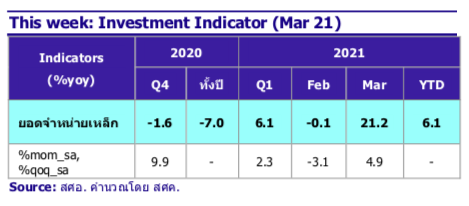
5. Domestic sales volume of steel and steel products in March 2021 grew by 21.2% year-on-year.
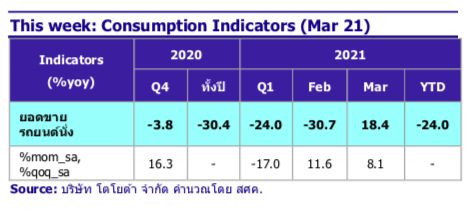
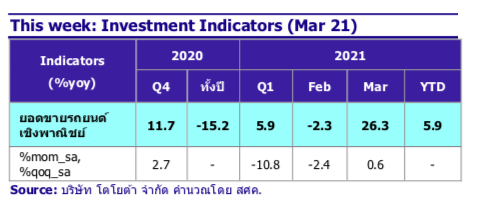
6. Sales volume of passenger cars in March 2021 grew by 18.4% year-on-year.
7. Sales volume of commercial vehicles in March 2021 grew by 26.3% year-on-year.
8. The agricultural production index in March 2021 grew by 0.6%, while the agricultural price index grew by 12.8% year-on-year.
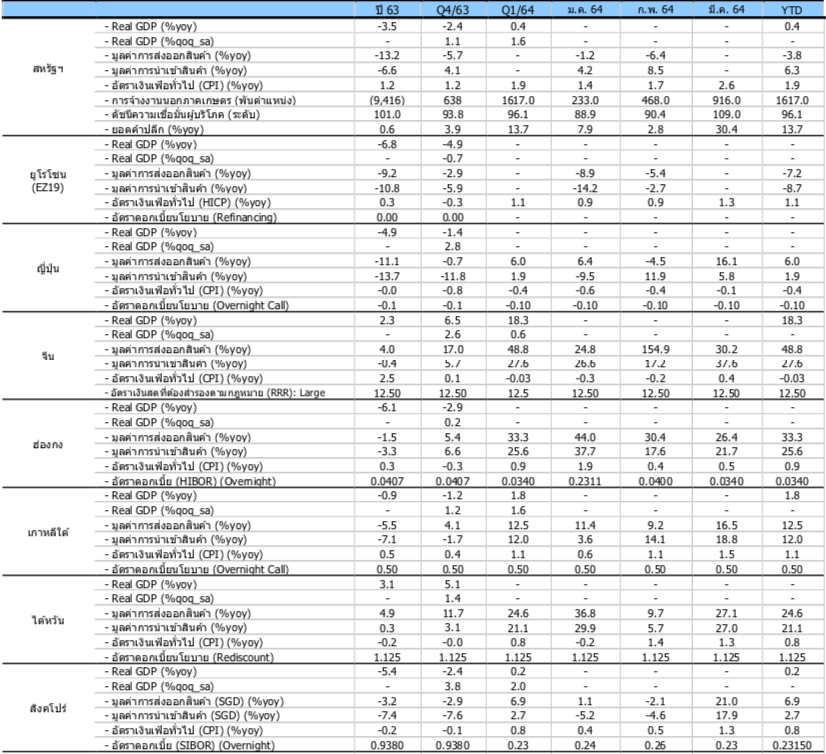
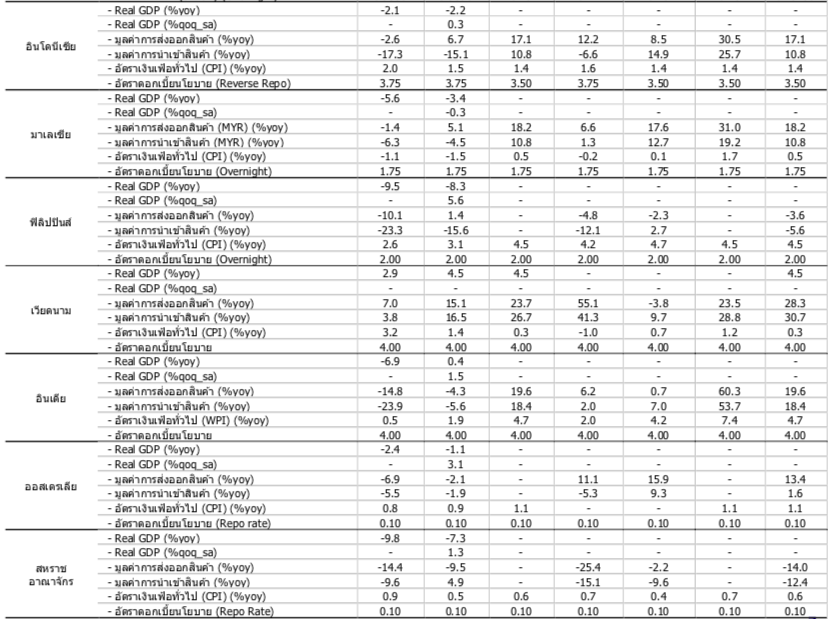
9. South Korea's GDP in Q1 2021 grew by 1.8% year-on-year.
Economic Indicators
The government collected net revenue (after allocation to local administrations) in March 2021 amounting to 171.136 billion baht, growing by 10.4% year-on-year, driven by a 15.5% growth in value-added tax, a 14.7% growth in personal income tax, and a 6.8% growth in corporate income tax.
The value-added tax collected by the government at constant prices in March 2021 grew by 15.2% year-on-year, and after adjusting for seasonal effects, it grew by 30.6% compared to the previous month. The value-added tax collected from domestic spending grew by 15.8% year-on-year, partly due to some VAT being deferred from February 2021 to March 2021, while the VAT collected from imports also grew well at 14.4% year-on-year, in line with the country's strong import trends.
Tax from real estate transactions in March 2021 grew by 17.8% year-on-year, marking the second consecutive month of growth, and grew by 7.4% compared to the previous month after seasonal adjustments. Tax collection expanded across all categories, especially in the specific business tax category, which grew significantly at 17.5% year-on-year, driven by consumer confidence returning as the COVID-19 situation began to ease (not including the impact of the new outbreak) and the government's economic stimulus measures. Additionally, real estate operators continued to offer promotional deals, and government tax measures effectively stimulated buyer demand. However, the new outbreak of COVID-19 is expected to reduce consumer confidence, which will be a crucial factor in future high-value asset purchases such as housing.
The Manufacturing Production Index (MPI) in March 2021 grew by 4.1% year-on-year and grew by 7.1% compared to the previous month after seasonal adjustments. The growth in the MPI in March 2021 was driven by significant expansions in key industries, including automotive, sugar, basic steel, furniture, and animal feed industries, which grew by 7.5%, 26.9%, 19.2%, 42.8%, and 15.5% year-on-year, respectively. Meanwhile, industries that continued to contract included petroleum refining, air conditioning, pharmaceutical and chemical manufacturing, textile spinning, and weaving, which contracted by -12.1%, -6.7%, -9.34%, -16.1%, and -14.4%, respectively.
The domestic sales volume of steel and steel products in March 2021 grew by 21.2% year-on-year and grew by 4.9% compared to the previous month after seasonal adjustments, with growth seen in nearly all steel products. This growth was partly due to a low base from the previous year, along with high demand for steel used in industries, such as cold-rolled steel, galvanized steel, and hot-rolled steel, which grew by 62.4%, 36.4%, and 27.7% year-on-year, respectively, in line with the continuous recovery of the manufacturing and export sectors due to the improving global economy. However, the new outbreak situation needs to be monitored as it may impact domestic steel demand.
The sales volume of passenger cars in March 2021 was 24,509 units, growing well at 18.4% compared to the same period last year, and after seasonal adjustments, it grew by 8.1% compared to the previous month. This growth was partly due to a low base from last year and promotional activities during the 2021 Motor Show, resulting in better-than-expected car booking numbers. However, the sales volume of passenger cars in Q1 2021 still contracted by -24.0% due to the impact of the second wave of COVID-19.
The sales volume of commercial vehicles in March 2021 was 49,786 units, returning to a high growth rate of 26.3% compared to the same period last year, and grew by 0.6% compared to the previous month after seasonal adjustments, driven by a 25.8% increase in one-ton pickup truck sales. Key factors included promotional activities and accelerated vehicle deliveries during the 42nd Motor Show held from March 24 to April 4, 2021, while last year's event was postponed to July 2020 due to the COVID-19 outbreak, resulting in a lower base. Additionally, continuous government relief and economic stimulus measures, the easing of the outbreak situation (not including the impact of the new outbreak), and high agricultural sector income due to less severe drought conditions than the previous year supported the growth in vehicle sales for the first time in a year.
The agricultural production index in March 2021 grew by 0.6% compared to the same period last year, or a contraction of -15.6% compared to the previous month after seasonal adjustments. Analyzing the agricultural product categories in March 2021, the agricultural production grew in the major crop and livestock categories by 0.6% and 2.8%, respectively, while the fisheries category contracted by -9.4%. Key products with increased production included paddy and pigs, while key products with decreased production included fruits and white shrimp. In the first quarter of 2021, the agricultural production index grew by 1.3%.
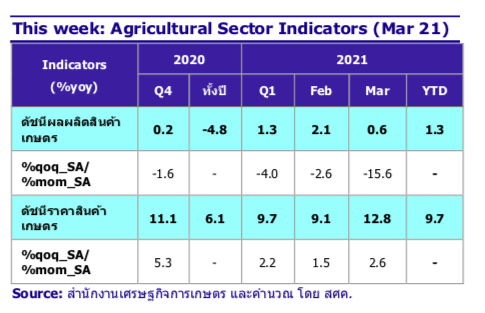
The agricultural price index in March 2021 grew by 12.8% compared to the same period last year, or a growth of 2.6% compared to the previous month after seasonal adjustments. Analyzing the agricultural price categories in March 2021, the agricultural price index grew in all product categories, with major crops, livestock, and fisheries growing by 16.4%, 1.8%, and 10.6%, respectively. Products with increased prices included rubber, cassava, palm oil, fruits, pigs, and white shrimp, while products with decreased prices included paddy, eggs, and chicken. In the first quarter of 2021, the agricultural price index grew well at 9.7%.
Global Economic Indicators
US
The GDP for Q1 2021 (preliminary) grew by 0.4% from the previous quarter, or 6.4% when annualized, and grew by 1.6% compared to the previous quarter (after seasonal adjustments). The housing price index in February 2021 increased by 12.2% year-on-year, slightly up from the previous month at 12.1% year-on-year, or a growth of 0.9% from the previous month (after seasonal adjustments), mainly due to price increases in the West North Central and Mountain regions. The Federal Open Market Committee (FOMC) decided to maintain the short-term interest rate at 0.00-0.25% per year until the labor market reaches full employment as assessed by the Fed and inflation rises to 2% per year. Additionally, it will continue to increase its holdings of Treasury securities by at least $80 billion per month and increase its holdings of mortgage-backed securities (MBS) by at least $40 billion per month. The number of initial unemployment claims for the week of April 18-24, 2021, was 553,000, a decrease from the previous week, marking the lowest level since the pandemic began in March 2020. However, this figure is still higher than the pre-pandemic weekly average of 230,000 claims.
China
The PMI for the manufacturing sector in April 2021 was at 51.1, down from 51.9 in March 2021, due to a slowdown in new orders and export volumes, consistent with the PMI for the services sector in April 2021 at 54.9, down from 56.3 in March 2021. However, both the manufacturing and services PMI remain above the 50.0 mark, indicating a good economic recovery following the COVID-19 crisis.
Eurozone
The consumer confidence index in April 2021 was at -8.1, up from -10.8 in March 2021, the highest level since February 2020, as economic activities began to recover gradually, along with the accelerated vaccination efforts in the Eurozone. Additionally, households began to have a positive outlook on the overall economy in the future.
Japan
The unemployment rate in March 2021 decreased to 2.6% from 2.9% in February 2021, while industrial production in March 2021 increased by 4% compared to the same period last year. Furthermore, the services PMI in April 2021 rose to 53.6 from 52.7 in the previous month due to increased factory activities and the easing of the COVID-19 outbreak.
Singapore
Industrial production in March 2021 grew by 7.6% year-on-year, down from 16.5% growth in the previous month, primarily due to a decline in biomedical manufacturing. Meanwhile, the business confidence index for Q1 2021 was at 38 points, up from 32 points in the previous quarter. However, the unemployment rate for Q1 2021 was at 2.9%, down from 3.2% in the previous quarter.
Weekly Financial Indicators
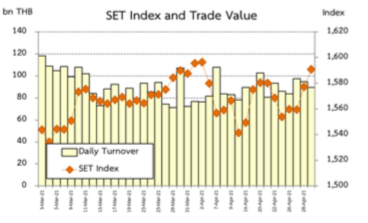
The SET index slightly decreased from the previous week, in line with other regional stock markets that also declined, such as Nikkei225 (Japan), JCI (Indonesia), and DJIA (USA). The SET index fell at the beginning of the week and gradually increased until the end of the week. On April 29, 2021, the index closed at 1,590.46 points, with an average trading value between April 26-29, 2021, of 91,351.87 million baht per day. Domestic retail investors and domestic institutional investors were net sellers, while foreign investors and securities accounts were net buyers. During April 26-29, 2021, foreigners bought securities worth 4,612.81 million baht.
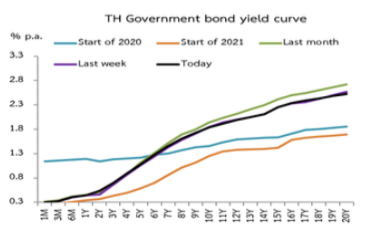
The overall yield on government bonds increased by 0 to 8 bps this week, with no government bond auctions held. During April 26-29, 2021, foreign investor capital flowed into the bond market, netting 11,989.82 million baht, and since the beginning of the year until April 29, 2021, foreign capital inflow into the bond market totaled 28,022.65 million baht.
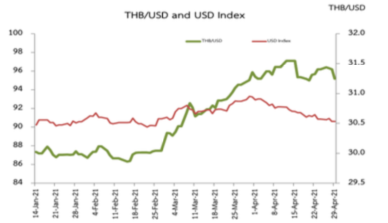
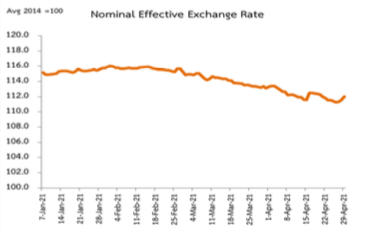
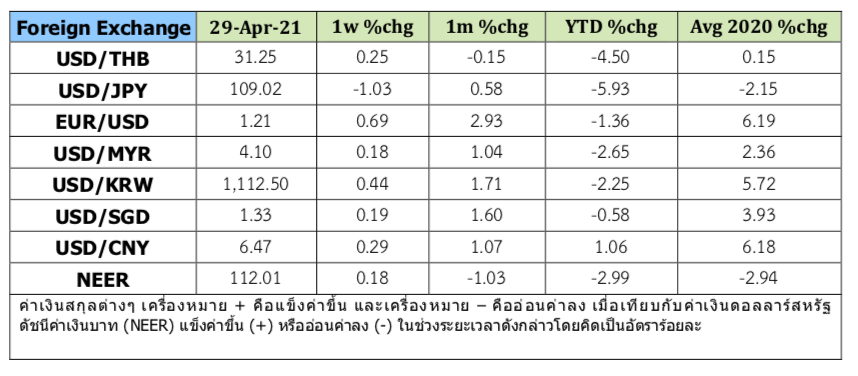
The Thai baht appreciated against the previous week, closing at 31.25 baht per US dollar on April 29, 2021, appreciating by 0.25% from the previous week, in line with other currencies such as the euro, ringgit, won, Singapore dollar, and yuan, which also appreciated against the US dollar. Meanwhile, the yen depreciated against the US dollar compared to the previous week. The baht's appreciation was greater than that of other currencies in the region, resulting in the nominal effective exchange rate (NEER) strengthening by 0.18% from the previous week.
Thai Economic Data
Economic Data of Thailand's 15 Trading Partners