วิเคราะห์ดัชนีกลุ่มพัฒนาอสังหาริมทรัพย์ ประจำวันที่ 26 กันยายน 2557
TerraBKK Research ขอ Update บทวิเคราะห์ทางเทคนิค ทั้งกราฟรายวันและกราฟรายสัปดาห์ในกลุ่มพัฒนาอสังหาริมทรัพย์ ประจำวันที่ 26 กันยายน 2557 ดังนี้

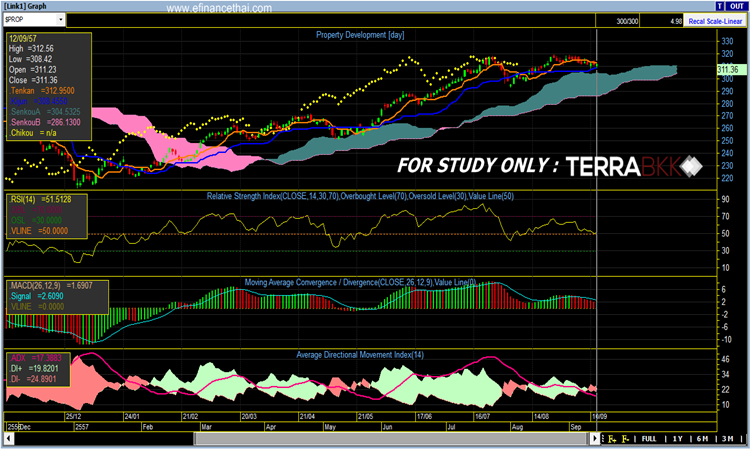
ดัชนีกลุ่มพัฒนาอสังหาริมทรัพย์ (Property Development) สุดสัปดาห์ปิด(Close)ที่ระดับ 320.12 จุด และสามารถปิดทำจุดสูงสุดใหม่ (New High) ได้ในรอบหลายเดือน ใน Time Frame Day เส้นแนวโน้ม Tenkan = kijun อยู่ในลักษณะ Uptrend ต่อไปได้ แนวรับอยู่ที่ 314.25 ถ้าดัชนีสามารถยืนเหนือ 314.25 ได้สามารถถือ let profit run ได้ตามแนวโน้มต่อไป แต่ถ้าหากหลุดให้เป็นจุดพิจารณาขายทำกำไร ทั้งนี้ขึ้นอยู่กับกลยุทธ์ของแต่ละบุคคล สำหรับ Indicator ตัวอื่นๆ RSI สามารถยืนเหนือ ระดับ 50 ได้ และมี momentum ที่ดีขึ้นต่อเนื่องช่วย Confirm ว่ายังเป็น Uptrend อยู่ ความแข็งแกร่งของแนวโน้ม (Trend) ถือว่าอ่อนแอมาก เนื่องจากตลาดยังไม่แสดงทิศทางที่ชัดเจน(Sideway)ว่าจะไปต่อหรือจะปรับตัวลงทำให้ ADX มีค่าเพียง 13.79
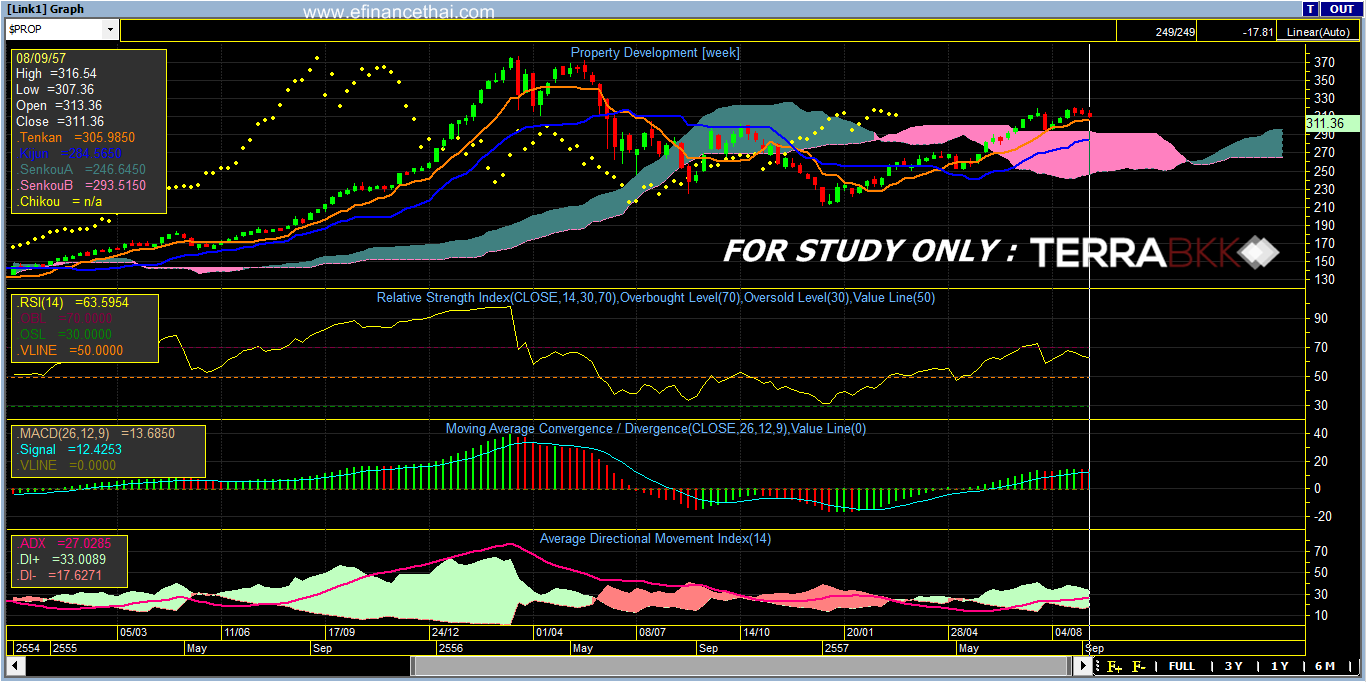
ภาพรายสัปดาห์(ระยะยาว) Time Frame Week สัญญาณยังคงแสดงขาขึ้นชัดเจนไม่ผันผวนเหมือน Time Frame Day หลังจากที่ดัชนีลงไปทดสอบเส้น Tenkan แล้วก็เกิดการกลับตัวของดัชนียืนเหนือเส้นได้และเคลื่อนไหวตามแนวโน้มขาขึ้นต่อไป TerraBKK Research ก็ยังคงมองว่าสำหรับนักลงทุนในระยะยาวยังเป็นแนวโน้มขาขึ้นสามารถปล่อยให้ดัชนีปรับตัวตามแนวโน้มในระยะยาวได้ต่อเนื่องเช่นเดิม
สรุป แนวโน้มยังเป็นขาขึ้น นักลงทุนทั้งระยะสั้นและระยะยาวที่มีหุ้นอยู่สามารถปล่อยให้เคลื่อนไหวในแนวโน้มขาขึ้นได้อยู่ไม่จำเป็นต้องขายทำกำไรใดๆออกมา อีกทั้งดัชนีกลุ่มพัฒนาอสังหาริมทรัพย์(Property Development)สุดสัปดาห์สามารถปิดทำจุดสูงสุดได้ ทำให้เป็นสัญญาณที่ดีที่จะเห็นดัชนีขึ้นไปทดสอบจุดสูงสุดใหม่ต่อๆไป
Indicator definition by investopedia. Moving Average Convergence Divergence – MACD : “A trend-following momentum indicator that shows the relationship between two moving averages of prices. The MACD is calculated by subtracting the 26-day exponential moving average (EMA) from the 12-day EMA. A nine-day EMA of the MACD, called the "signal line", is then plotted on top of the MACD, functioning as a trigger for buy and sell signals.” Relative Strength Index - RSI : “A technical momentum indicator that compares the magnitude of recent gains to recent losses in an attempt to determine overbought and oversold conditions of an asset.” Average Directional Index – ADX : “An indicator used in technical analysis as an objective value for the strength of trend. ADX is non-directional so it will quantify a trend's strength regardless of whether it is up or down. ADX is usually plotted in a chart window along with two lines known as the DMI (Directional Movement Indicators). ADX is derived from the relationship of the DMI lines.”บทความโดย : TerraBKK ข่าวอสังหาฯ
TerraBkk ค้นหาบ้านดี คุ้มค่า ราคาถูก