New Housing Price Index for Properties Under Sale in Q2 2024 in Bangkok and Surrounding Areas
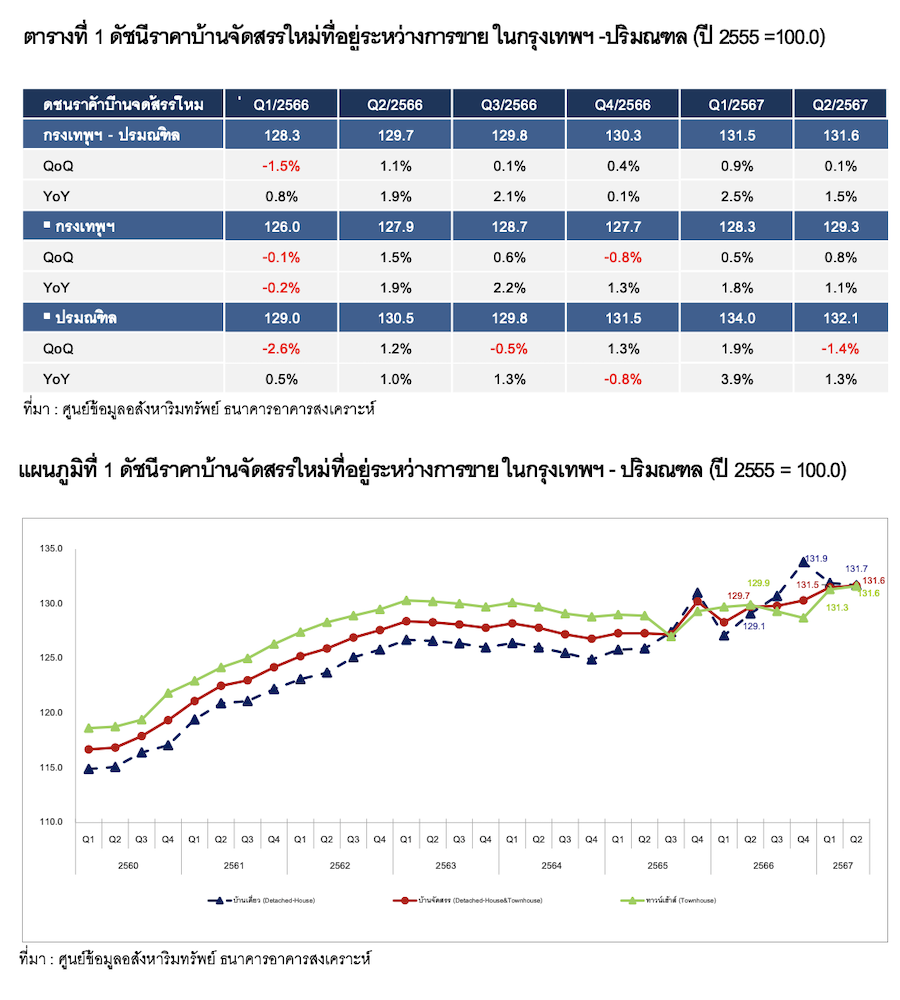
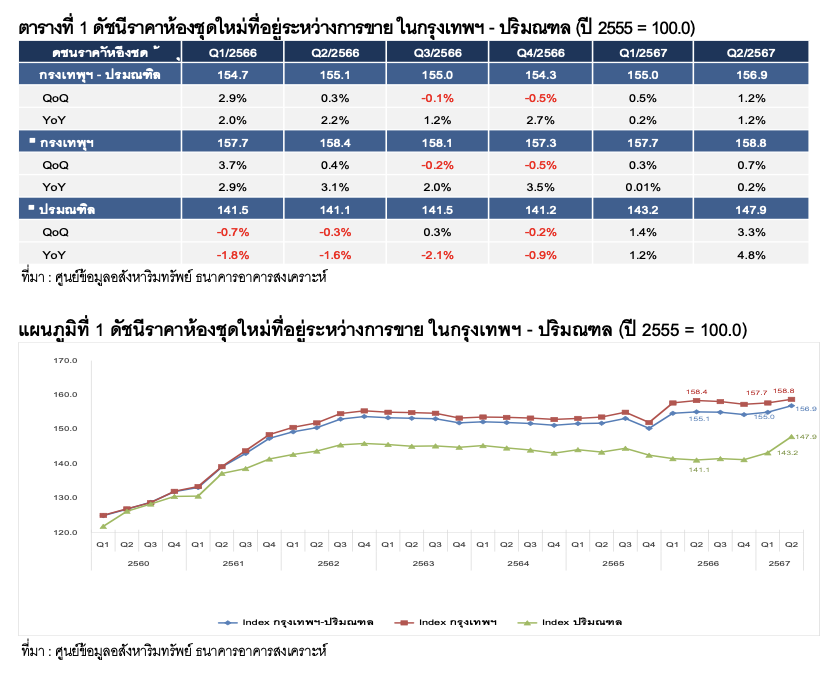
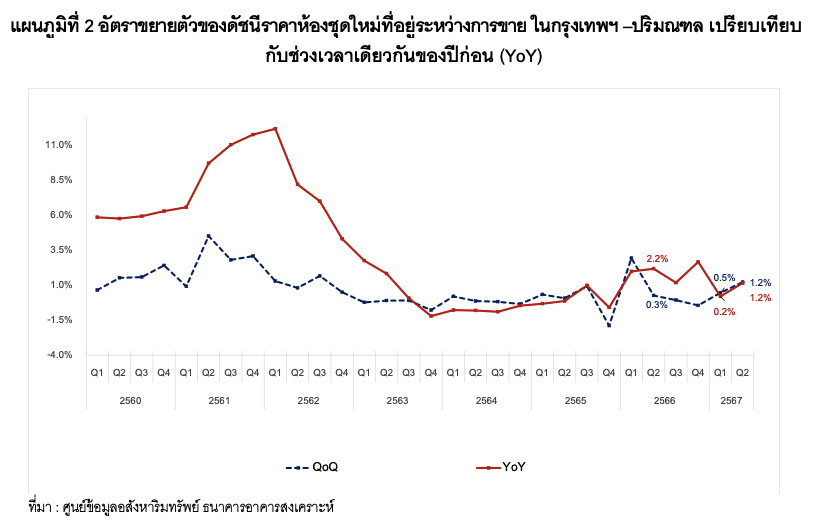
The Real Estate Information Center (REIC) reports that the new housing price index for properties under sale in Bangkok and its vicinity for Q2 2024 shows that the overall index for new housing projects stands at 131.6, reflecting a 1.5% increase compared to the same period last year (YoY), when the index was 129.7. This marks a continuous increase for six consecutive quarters, from Q1 2023 to Q2 2024. Compared to Q1 2024 (QoQ), the index for new housing projects has risen by 0.1%. Meanwhile, the overall index for new condominiums under sale in Bangkok and its vicinity for Q2 2024 is at 156.9, which is a 1.2% increase YoY, also reflecting a continuous YoY increase for six quarters from Q1 2023 to Q2 2024, and a QoQ increase of 1.2%.
New Housing Price Index (Single-Family Homes and Townhouses)
Dr. Vichai Viratakphan, Acting Director of the Real Estate Information Center at the Government Housing Bank revealed that the new housing price index for properties under sale in Bangkok and its vicinity for Q2 2024 stands at 131.6, showing a 1.5% increase YoY from 129.7. This increase has been consistent for six quarters from Q1 2023 to Q2 2024. Compared to Q1 2024 (QoQ), the index has risen by 0.1%, indicating a steady price adjustment for new housing projects both YoY and QoQ.
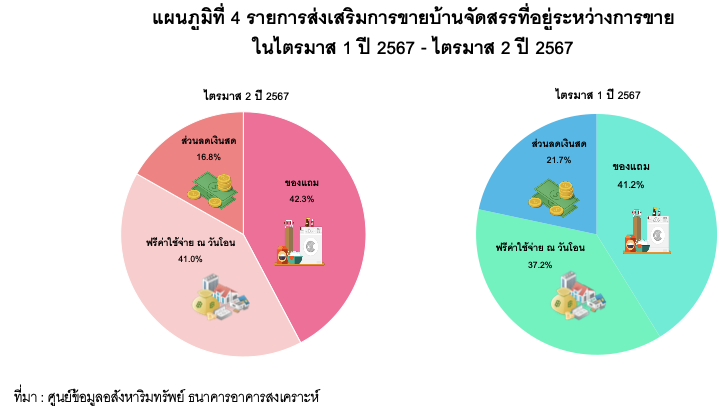
The continuous rise in the new housing price index is primarily attributed to increased construction costs driven by various factors, including rising land prices, construction material costs, and labor costs, all of which directly impact housing construction costs. Consequently, the prices of housing projects launched in 2022-2023 have increased in line with these higher costs to stimulate sales. In this quarter, most developers employed promotional strategies to boost sales, offering incentives such as free air conditioning, water pumps, water tanks, water meters, electricity meters, and grass flooring, amounting to 42.3%. Additionally, they provided assistance with transfer costs at 41.0% to ease the burden on buyers.
When analyzing the housing price index by area, it was found that:
- Bangkok has an index value of 129.3, reflecting a 1.1% increase YoY and a 0.8% increase QoQ.
- Three surrounding provinces (Nonthaburi, Pathum Thani, and Samut Prakan) have an index value of 132.1, showing a 1.3% increase YoY but a decrease of 1.4% QoQ (see Table 1 and Charts 1-3).
Single-Family Home Price Index
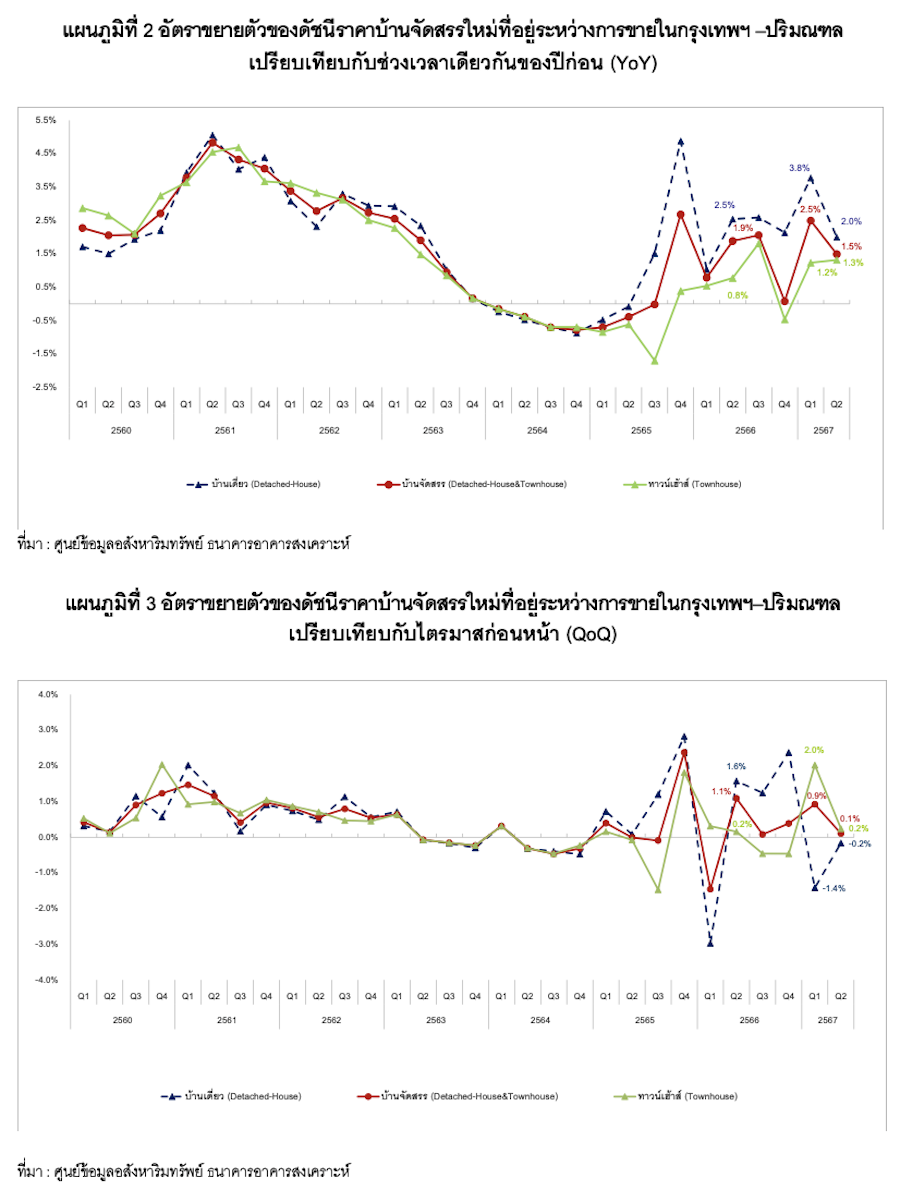
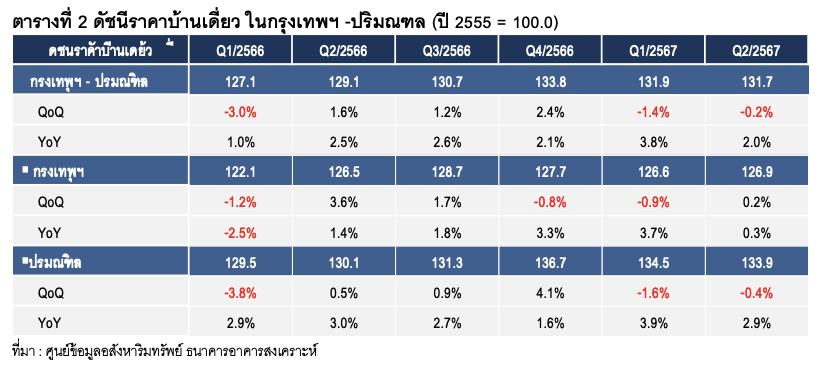
The price index for single-family homes under sale in Bangkok and its vicinity for Q2 2024 is at 131.7, indicating a 2.0% increase YoY (YoY), marking a continuous increase for 8 quarters from Q3 2022 to Q2 2024, but showing a decrease of 0.2% QoQ.
- Bangkok has an index value of 126.9, reflecting a 0.3% increase YoY (YoY) and a 0.2% increase QoQ. Additionally, to stimulate sales of single-family homes in Q2 2024, it was found that most price reductions were applied to high-end single-family homes priced above 10 million baht. To stimulate the market and accelerate stock clearance, price reductions were observed in the Min Buri-Nong Chok-Khlong Sam Wa-Lad Krabang area, followed by the Lat Phrao-Bang Kapi-Wang Thonglang-Bueng Kum-Saphan Sung-Khan Na Yao area and the Phra Khanong-Bang Na-Suan Luang-Pravet area.
- Three surrounding provinces (Nonthaburi, Pathum Thani, and Samut Prakan) have an index value of 133.9, reflecting a 2.9% increase YoY (YoY) but a decrease of -0.4% QoQ. It was found that the price of single-family homes has increased continuously for 9 quarters from Q2 2022 to Q2 2024 (see Table 2 and Charts 1-3), resulting from new projects launched in 2022-2023 with higher costs due to increased construction material prices. The areas with the most significant price increases include the Lam Luk Ka-Khlong Luang-Thanyaburi-Nong Suea area in the price range of 3.01 – 5.00 million baht, followed by the Bang Phli-Bang Bo-Bang Sao Thong area in the price range of 5.01 – 7.50 million baht, and the Bang Krui-Bang Yai-Bang Bua Thong-Sai Noi area in the price range of 5.01-7.50 million baht.
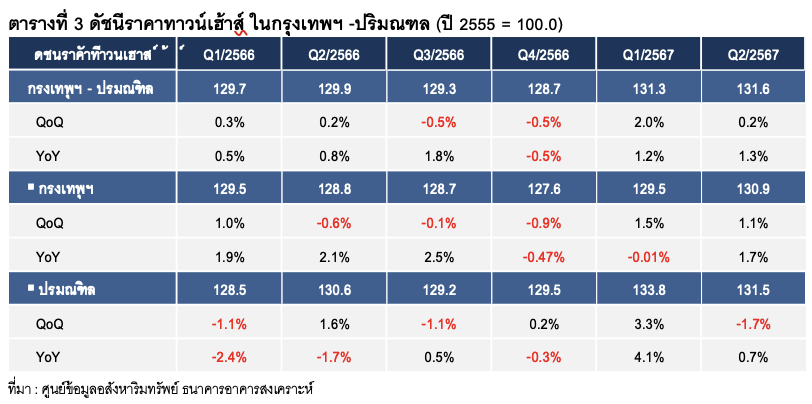
Townhouse Price Index The townhouse price index in Bangkok and its vicinity for Q2 2024 is at 131.6, reflecting a 1.3% increase YoY and a 0.2% increase QoQ.
- Bangkok has an index value of 130.9, reflecting a 1.7% increase YoY and a 1.1% increase QoQ. There has been a continuous increase in the price index since Q1 2024 after experiencing a decline for three consecutive quarters from Q2 2023 to Q4 2023, primarily due to older projects from 2021 where production costs remained unchanged, and reductions were made to stimulate the market and clear stock. The most significant price reductions were found in the Lat Phrao-Bang Kapi-Wang Thonglang-Bueng Kum-Saphan Sung-Khan Na Yao area in the price range of 5.00-7.50 million baht, followed by the Min Buri-Nong Chok-Khlong Sam Wa-Lad Krabang area in the price range of 2.01 – 3.00 million baht and the Rat Burana-Bang Khun Thian-Thung Khru-Bang Bon-Chom Thong area in the price range of 3.01 - 5.00 million baht.
- Three surrounding provinces (Nonthaburi, Pathum Thani, and Samut Prakan) have an index value of 131.5, reflecting a 0.7% increase YoY but a decrease of -1.7% QoQ. It was found that the areas with price increases were primarily in the Bang Krui-Bang Yai-Bang Bua Thong-Sai Noi area in the price range of 2.01 – 3.00 million baht, followed by the Bang Phli-Bang Bo-Bang Sao Thong area in the price range of 3.01 – 5.00 million baht and the Lam Luk Ka-Khlong Luang-Thanyaburi-Nong Suea area in the price range of 2.01 – 3.00 million baht compared to the same period last year.
It is noteworthy that the increase in townhouse prices in the surrounding areas is greater than in Bangkok, which aligns with the changes in land prices in the surrounding areas.
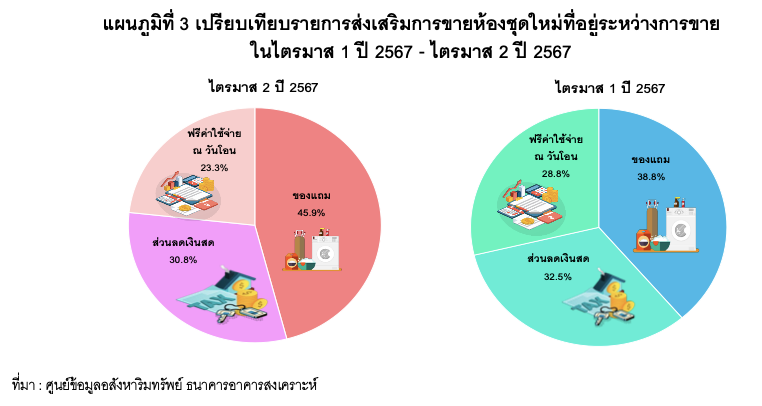
Regarding promotional offers for new housing projects under sale in this quarter, it was found that most offers included incentives such as free air conditioning, water pumps, water tanks, water meters, electricity meters, and grass flooring, amounting to 42.3%, an increase from the previous quarter which was 41.2%. Following this, discounts on transfer costs were at 41.0%, up from 37.2% in the previous quarter, while cash discounts were at 16.8%, down from 21.7% in the previous quarter (see Chart 4).
Data Compilation Method
The new housing price index for properties under sale consists of the price index for single-family homes and the price index for townhouses in new housing projects that are still under sale. Projects under sale refer to those with at least 6 units available for sale. In compiling this price index, second-hand homes are not included.
The data collection area includes Bangkok and its vicinity, comprising Bangkok, Nonthaburi, Pathum Thani, and Samut Prakan, covering only 4 provinces.
The sampling method for compiling this price index will use purposive sampling with a total of 245 samples. The sale prices used for this index are actual sale prices, excluding the value of promotional items from the listed sale prices, using the year 2012 as the base year.
The index for new condominiums under sale refers to the prices of condominiums in projects with at least 6 units available for sale. In compiling this price index, second-hand condominiums are not included.
The data collection area includes Bangkok and its vicinity, comprising Bangkok, Nonthaburi, and Samut Prakan, covering only 3 provinces.
The sampling method for compiling this price index will use simple random sampling with a total of 150 samples. The sale prices used for this index are actual sale prices, excluding the value of promotional items from the listed sale prices, using the year 2012 as the base year.