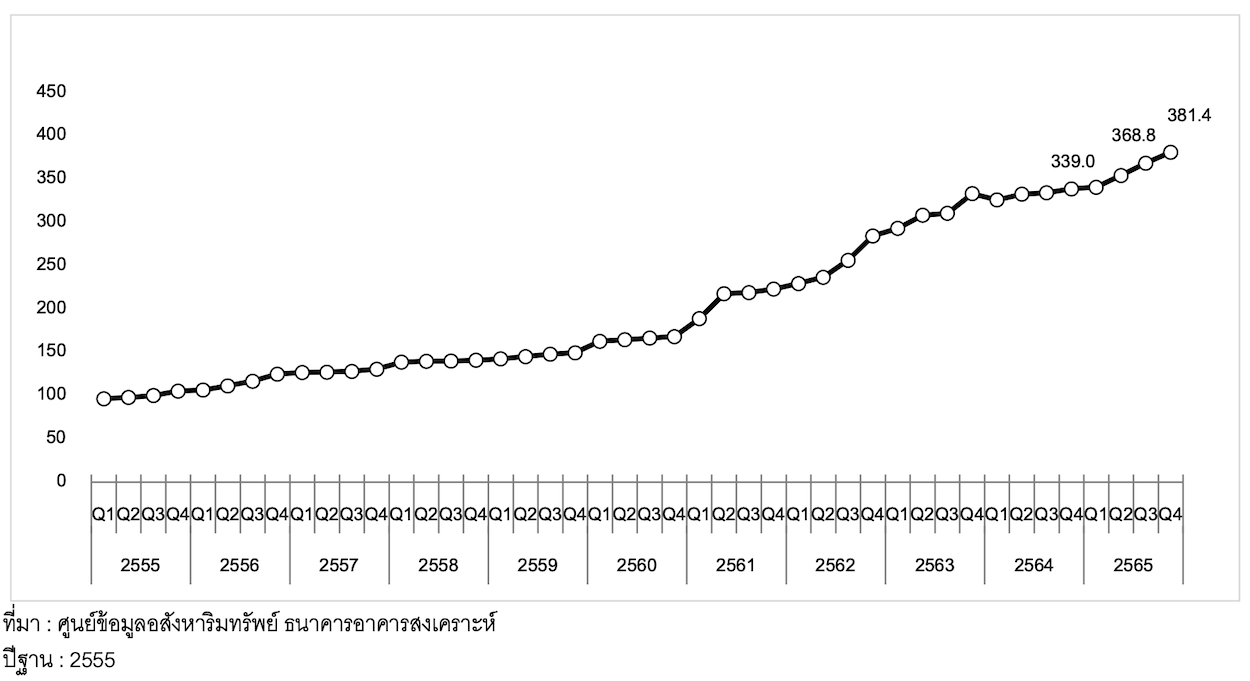
Index of Vacant Land Prices Before Development in Bangkok and Surrounding Areas - Q4 2022
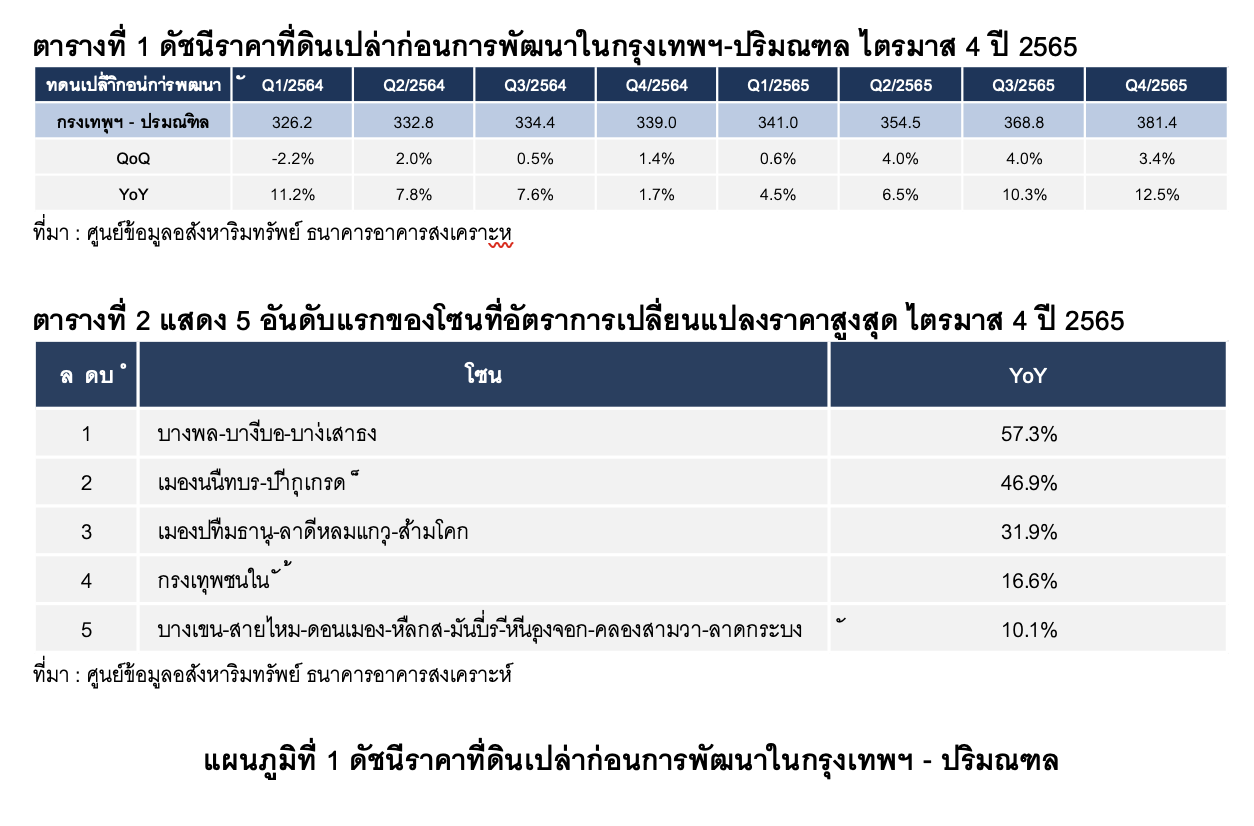
The Real Estate Information Center of the Government Housing Bank reports that the index of vacant land prices before development in Bangkok and its vicinity for Q4 2022 stands at 381.4 points, reflecting a 3.4% increase compared to the previous quarter (QoQ) and a 12.5% increase year-on-year (YoY). This indicates a continuous rise in vacant land prices before development, although at a rate slightly lower than the average increase of 14.8% YoY observed in the five years prior to the COVID-19 crisis (2015-2019). The average increase from the previous quarter is 4.1% (see Table 1 and Charts 1-2).
Dr. Vichai Wiratthakhan, Acting Director of the Real Estate Information Center at the Government Housing Bank revealed that the factors contributing to the slower increase in vacant land prices include the economic slowdown due to the COVID-19 pandemic and the ongoing conflict between Russia and Ukraine, which continues to affect the global economy. This may lead to a reduced growth rate for the Thai economy in 2023. Additionally, the government has announced the full collection of land and building taxes without the 90% discount that was available in 2019-2020. The Treasury Department has also announced new land appraisal prices for the period 2023-2026, effective January 1, 2023, after postponing the new round since 2021, resulting in an average increase of about 8% in land appraisal prices nationwide. These factors have led landowners to release land supply into the market to reduce their tax burden, while demand for land purchases has also decreased.
In Q4 2022, the zones with the highest growth rates in land prices compared to the same quarter of the previous year (YoY) are as follows:
Rank 1: Land in the Bangplee-Bangbo-Bangsaothong zone saw a price change of 57.3%.
Rank 2: Land in the Nonthaburi-Pakkret zone experienced a price change of 46.9%.
Rank 3: Land in the Pathum Thani-Lad Lum Kaew-Sam Khok zone had a price change of 31.9%.
Rank 4: Land in the inner Bangkok zone saw a price change of 16.6%.
Rank 5: Land in the Bang Khen-Sai Mai-Don Mueang-Lak Si-Min Buri-Nonthaburi-Khlong Sam Wa-Lad Krabang zone experienced a price change of 10.1% (see Table 2).
The changes in land prices reflect that land in the suburban areas of Bangkok and its vicinity is continuously increasing in price, as the selling prices are still relatively low and there is a strong demand for development into low-rise residential areas, which helps control housing costs in line with affordability. In contrast, land prices in the inner and middle districts of Bangkok are already high, and although there has been some adjustment, the percentage change in prices is not as high as in suburban areas.
For vacant land prices before development along the routes with electric trains in this quarter, the top five electric train routes with the highest growth rates in land prices compared to the same quarter of the previous year (YoY) are primarily lands with existing and future electric train projects, detailed as follows:
Rank 1: MRT, which is an existing project with an index of 508.3 points, saw a price increase of 16.6% YoY, with land prices in the Bang Sue area experiencing significant increases.
Rank 2: Dark Red Line (Bang Sue-Hua Lamphong), a future project with an index of 500.4 points, also saw a price increase of 16.6% YoY, with land prices in the Bang Rak and Samphanthawong areas rising significantly.
Rank 3: Green Line (Mo Chit-Saphan Mai-Khukhot), an existing project with an index of 477.3 points, experienced a price increase of 16.6% YoY, with land prices in the Chatuchak, Don Mueang, and Bang Khen areas rising significantly.
Rank 4: Blue Line (Hua Lamphong-Bang Khae), an existing project with an index of 488.4 points, saw a price increase of 13.1% YoY, with land prices in the Phasi Charoen area experiencing significant increases.
Rank 5: Gold Line (Thonburi-Phra Chathipok), an existing project with an index of 481.4 points, also saw a price increase of 13.1% YoY, with land prices in the Khlong San area rising significantly (see Table 3 and accompanying maps).


Data Collection Method
The Real Estate Information Center of the Government Housing Bank monitors changes in vacant land prices before development in the Bangkok and surrounding areas, covering six provinces: Bangkok, Nonthaburi, Pathum Thani, Samut Prakan, Samut Sakhon, and Nakhon Pathom. The base year is set as 2012, and the index is compiled quarterly.
The study uses data on the transfer of vacant land ownership from the Land Department, selecting only vacant land without buildings, with a minimum size of 200 square wah. It focuses solely on transfers where the transferor or transferee is a "juristic person," as these transactions typically reflect actual sale prices, which real estate development companies must accurately record for tax calculation and annual expenses.
The index calculation employs the Chain Laspeyres method, using the average price per square wah of vacant land weighted by the value of land ownership transfers in the Bangkok and surrounding areas from 2012 to 2016. Factors analyzed through multiple regression analysis include:
1) Location of the land
2) Land use zoning plans
3) Routes of mass transit electric trains