Market Summary 15 Dec 2014. SET Panic Sell -138!!
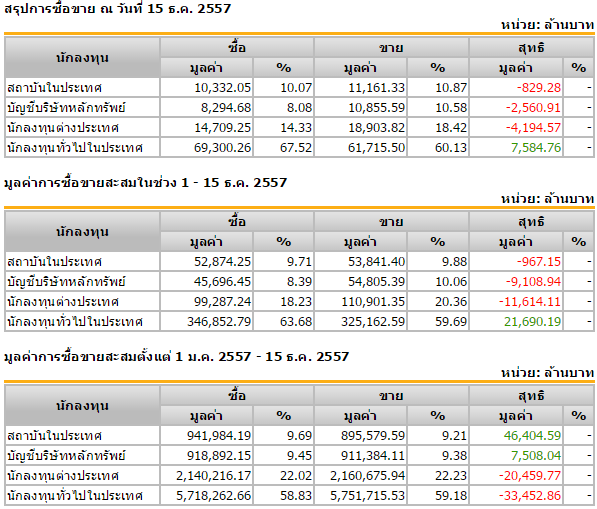
TerraBKK Research สรุปภาพรวมการซื้อขายหุ้น ของวันที่ 15 ธันวาคม 2557 หลังนักลงทุนต่างชาติขายสุทธิต่อเนื่องเป็นวันที่ 4 ติดต่อกัน ด้วยปริมาณการขายสุทธิที่มากขึ้นเป็น -4,194.57 ล้านบาท
(คลิ๊กที่ภาพเพื่อขยาย)
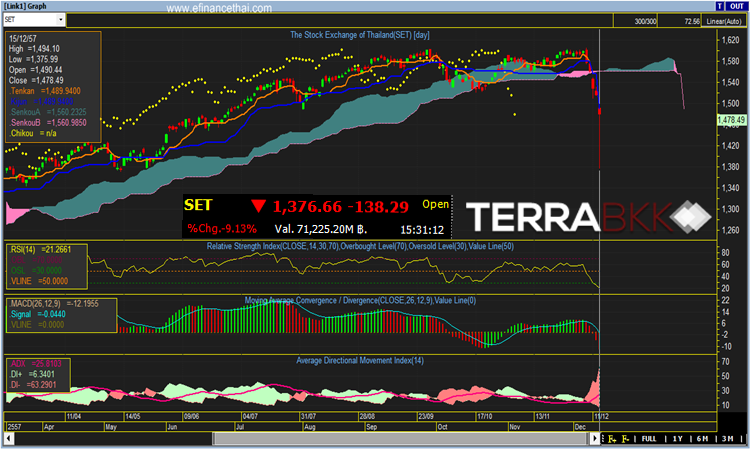
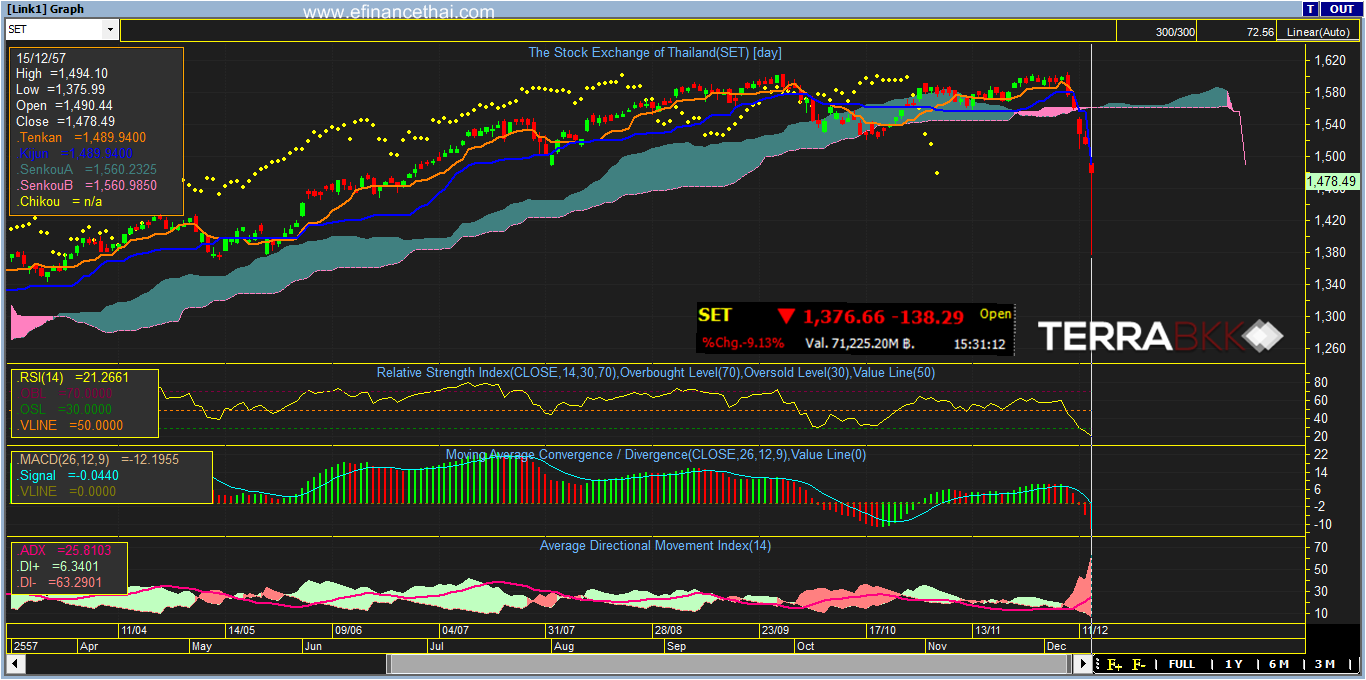
ในช่วงระหว่างวันดัชนีเกิดการ Panic Sell ลดลงต่ำสุด ถึง -138 จุด และ Rebound มาปิดลบประมาณ -36 จุด ดัชนีต่ำสุดอยู่ที่ 1,375.99 จุด ปิดที่ 1,478.49 จุด ลดลงจากวันก่อนหน้า 36.46 จุด ปรับลบมาตั้งแต่วันที่ 8/12/2557 ลงต่อเนื่องเป็นวันที่ 5 ทางเทคนิคมองเป็นการปรับตัวในขาลงเต็มตัวอาจจะเกิดการ Rebound ขึ้นมาในช่วงสั้น การ Rebound ที่จะเกิดคงเป็นการ Rebound เพื่อขาย และเล่นตามแนวโน้มระยะสั้นซึ่งเป็นขาลงต่อไป (Down Trend) ในช่วงนี้ไม่ควรซื้อสวนแนวโน้มควรเล่นไปตามแนวโน้ม ตามแนวคิด “The Trend Is Your Friend Till It Isn't” และควรกำหนดจุด Stop Loss ตามไปด้วย
(คลิ๊กที่ภาพเพื่อขยาย)
"การลงทุนมีความเสี่ยง ผู้ลงทุนโปรดศึกษาข้อมูลก่อนตัดสินใจลงทุน"
Indicator definition by investopedia. Moving Average Convergence Divergence – MACD : “A trend-following momentum indicator that shows the relationship between two moving averages of prices. The MACD is calculated by subtracting the 26-day exponential moving average (EMA) from the 12-day EMA. A nine-day EMA of the MACD, called the "signal line", is then plotted on top of the MACD, functioning as a trigger for buy and sell signals.” Relative Strength Index - RSI : “A technical momentum indicator that compares the magnitude of recent gains to recent losses in an attempt to determine overbought and oversold conditions of an asset.” Average Directional Index – ADX : “An indicator used in technical analysis as an objective value for the strength of trend. ADX is non-directional so it will quantify a trend's strength regardless of whether it is up or down. ADX is usually plotted in a chart window along with two lines known as the DMI (Directional Movement Indicators). ADX is derived from the relationship of the DMI lines.”บทความโดย : TerraBKK ข่าวอสังหาฯ
TerraBkk ค้นหาบ้านดี คุ้มค่า ราคาถูก