
Review of Thai Household Debt Status
Dr. Prasart Tangmattatham
The criticism regarding Thai household debt has been ongoing and increasingly intense, with little consideration of alternative perspectives. The primary critique focuses on the rising household debt-to-GDP ratio, but it is unclear whether this has reached a truly dangerous level. Analyzing the household debt-to-GDP ratio in comparison to other countries with varying ratios is essential, taking into account the unique factors affecting each country.
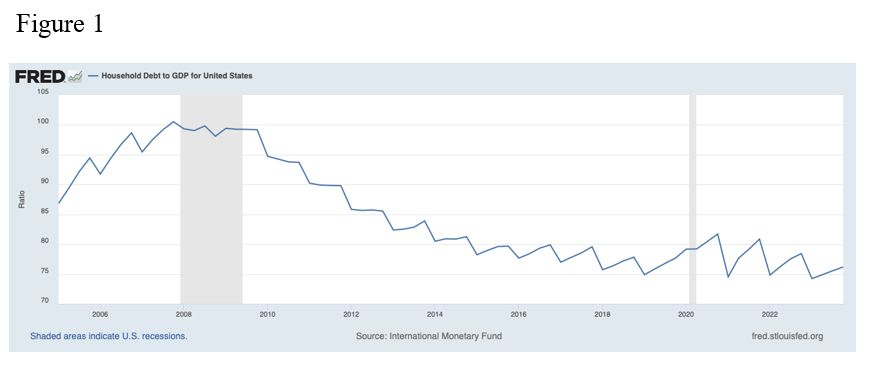
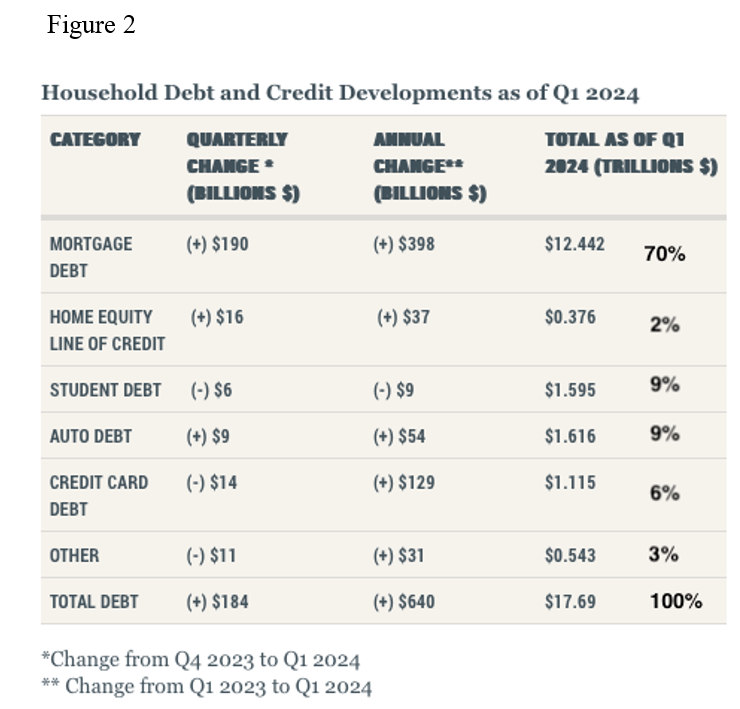
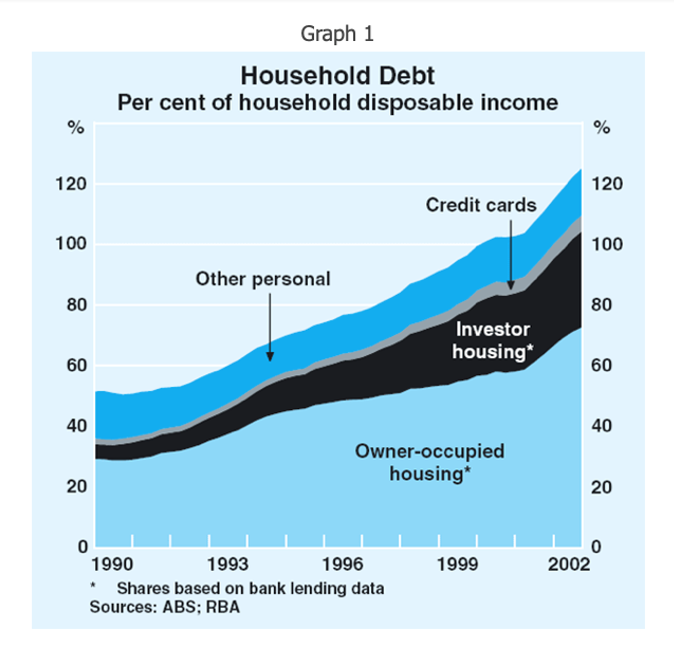
For instance, Figure 1 shows that the United States had a peak household debt-to-GDP ratio of around 100% during the financial crisis, gradually stabilizing between 75-80%. Mortgage loans constitute the largest share, approximately 70% of total household debt, as illustrated in Figure 2. Malaysia's household debt-to-GDP ratio stands at 84.7% at the end of 2023 (Arfa 2024), with home loans accounting for about 60% and car loans around 13% of total household debt. Malaysia's car loans support the national ProtonSaga initiative, with repayment terms extending up to 9 years. Singapore's household debt-to-GDP ratio is approximately 53% as of March 2024, with home loans making up about 75% of total household debt, while other types of debt are minimal due to the low car ownership among Singaporeans. However, Singapore's household debt-to-GDP ratio once reached 96% between 2003-2007 during a housing boom, which decreased as incomes rose. Australia experienced a peak household debt-to-GDP ratio of around 120% from 2017-2020 due to a housing boom, with residential loans comprising about 60% of total loans, and housing loans alone accounting for around 100% of GDP, as shown in Graph 1. Other loans represent a very small proportion.
Thus, it can be summarized that countries with high GDP growth tend to have lower household debt-to-GDP ratios. Next, it is crucial to examine whether those countries have significant other types of loans available to households, as seen in Malaysia.
In Thailand, Thansin (2024) has compiled detailed data from various angles. The household debt-to-GDP ratio has continuously increased, peaking at around 97% in 2020 before declining to approximately 91%.
Figure 10 illustrates the composition of total household debt. Housing loans account for about 36% of total household debt. This figure aligns with data from the Bank of Thailand. However, the Bank of Thailand reports that car loans and motorcycle loans are at 11.5%, which is lower than the figure shown, while consumer loans are around 29%, significantly higher than the figure.
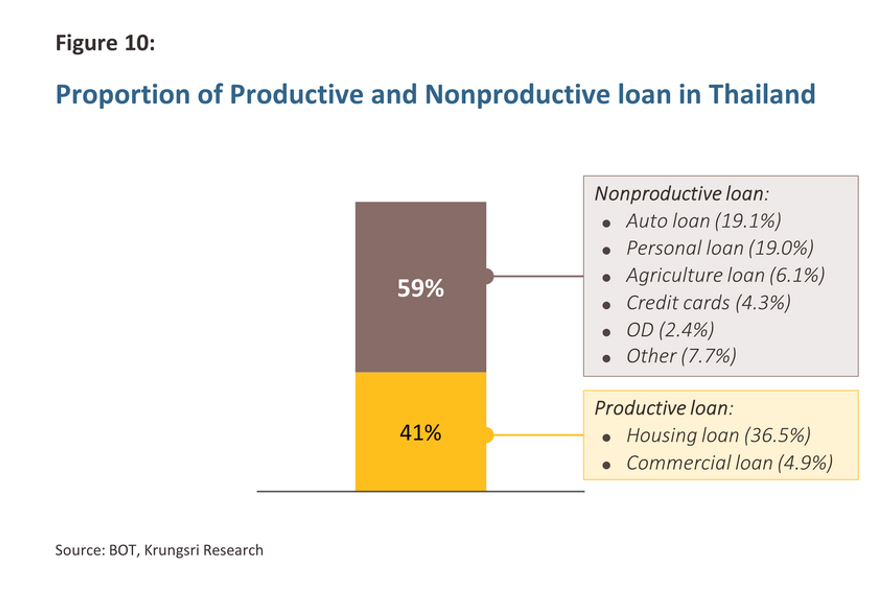
The 36% share of housing loans in total household debt is considered low compared to the United States, Malaysia, Singapore, and Australia. The 11.5% for car loans is also not high, but consumer loans, whether from the Bank of Thailand or Thansin (2024), are significantly higher than in other countries. Therefore, the focus should be on consumer loans.
The household debt-to-GDP ratio alone cannot indicate danger to the economic system; it is essential to delve into the components of household debt to assess which types of loans threaten financial stability and to evaluate the NPL (non-performing loans) rates or loans overdue by more than 90 days.
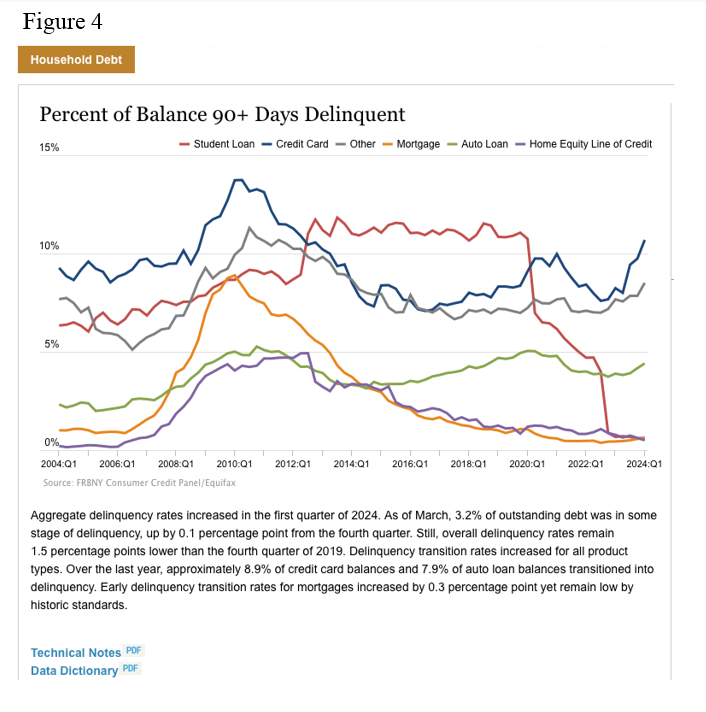
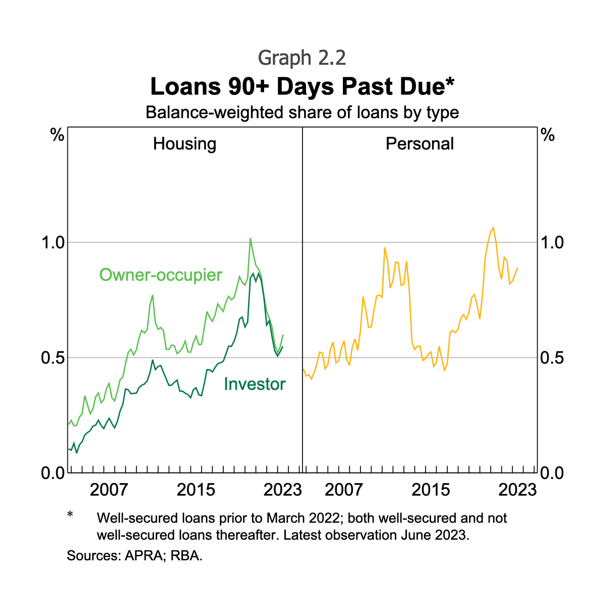
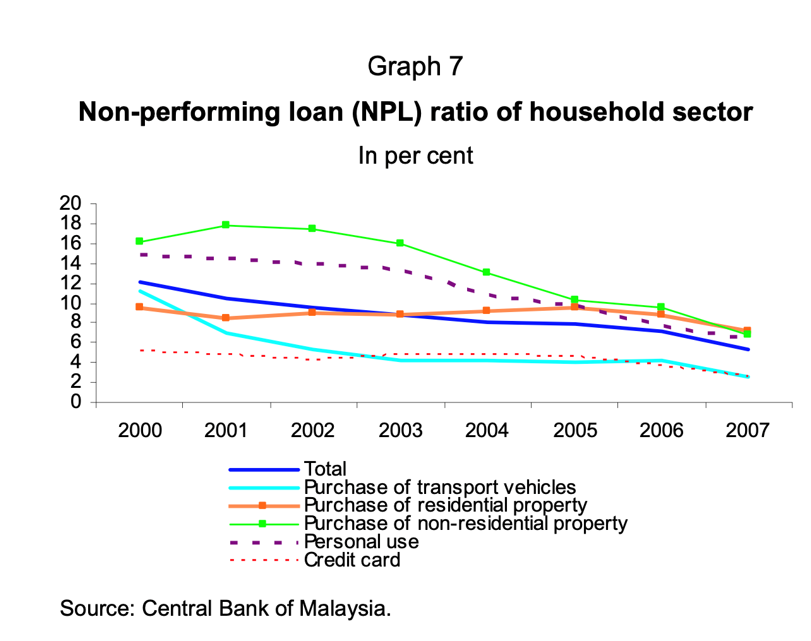
Figure 4 shows the NPL ratios of various types of household loans in the United States. Currently, housing loans, personal loans, and student loans have low NPL rates of only 1-2%. Housing loans peaked at around 9% during the subprime crisis in 2010 but stabilized around 4-5% from 2019-2024. Credit card loans have an NPL rate of about 10%, and car loans around 4%. In Singapore, the NPL for housing loans is about 0.2%, and other loans around 0.6%, among the lowest in the world, as Singaporeans have high incomes sufficient for their spending needs (Wong, 2023). In Australia, overdue loans exceeding 90 days are shown in Graph 2.2, where housing loans and other personal loans have gradually increased over the past 20 years but remain below 1%. Those familiar with Australian financial institutions know they are very strict. Additionally, housing loans undergo repayment capacity tests before loan approval, requiring a buffer added to the market interest rate of 2 percentage points. For the NPL status in Malaysia, as shown in Graph 7, while the data may be somewhat outdated, it indicates that credit card debt and car loans have an NPL of around 2%, while housing loans and personal loans have an NPL of about 6%.
Thansin (2024) compares the NPL percentages of various loan types extended to households, as shown in Figure 5. Before comparing Thailand's data with other countries, it is essential to consider the financial market conditions that are somewhat similar. Financial products in Thailand operate relatively freely, resembling the United States more than other countries that focus on specific types of financial products, such as Australia or Singapore.
When comparing the NPL percentages of Thai household debt with those of the United States, it is evident that the NPL rates for credit card loans and car loans are higher than those in Thailand, which are around 3.5% and 2%, respectively. Although there has been criticism regarding the quality of car loans in Thailand being inferior to other types of loans, with about 15% classified as level 2 loans, this has gradually increased since the onset of the COVID-19 pandemic from 9%. However, it is important to note the NPL levels.
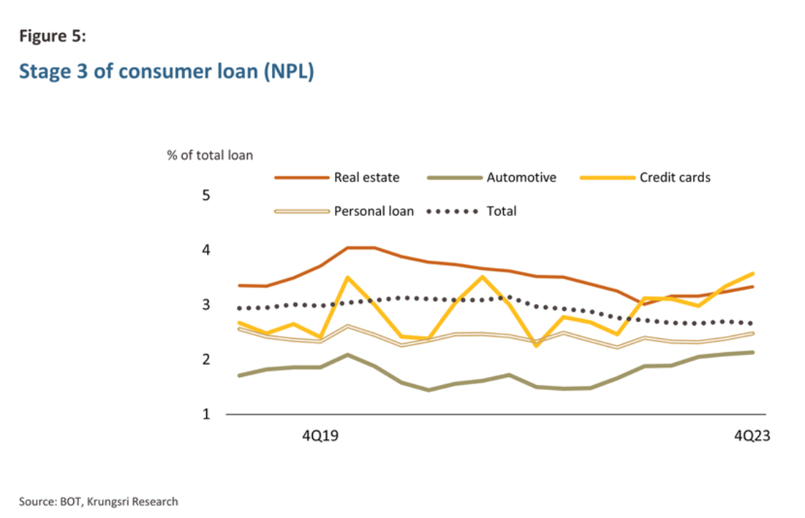
The NPL rate for car loans has consistently remained around 2%, indicating that businesses in this sector, mostly publicly listed companies, are likely aware of and managing credit quality reasonably well. However, both credit card and car loans in Thailand should be monitored for potential upward trends.
Housing loans in Thailand have a higher NPL percentage than other types of household debt, but there is no clear upward trend, remaining within the 3-4% range. Although the NPL percentage is higher than in the United States, Australia, and Singapore, it must be acknowledged that the higher incomes in those countries contribute to better housing loan quality.
Another critical issue to consider is household spending. Figure 13 in Thansin (2024) shows that households with monthly incomes below 50,000 baht, which make up about 80% of all households, are spending on average about 20% more than their income. This indicates that the excess spending must come from loans. However, this phenomenon is not unusual, as governments worldwide (except the United States) also spend beyond their income or run deficits. It is simply a matter that requires consistent attention.
The analysis above regarding various aspects of household debt shows that a rising and/or high household debt-to-GDP ratio does not always lead to a dangerous situation for the financial system. The critical component of household debt among all loan types is housing loans. Whether other types of loans are significant components of total household debt depends on the unique fundamentals of each country. For example, Singaporeans have less need for cars, resulting in a lower proportion of car loans. Credit card loans may be less necessary in high-income countries like the United States, Singapore, and Australia. In Thailand, the high proportion of households earning below 50,000 baht per month may contribute to credit card and personal loans exceeding 20%. Nevertheless, the overall NPL percentage for various loan types remains at an average of no more than 3%. While this is not considered low, it is still not overall dangerous. Although credit card loans and housing loans have NPL percentages exceeding the average, they are not excessively high.
Maintaining a low NPL percentage is a direct responsibility of the Bank of Thailand and a test of its sincerity. It is not enough to merely state that household debt is important and problematic. From an extreme perspective, one might ask whether the Bank of Thailand would dare and sincerely implement strict measures like those in Australia, which include adding a buffer to the market interest rate to test consumers' repayment capacity. If so, the NPL percentage of household debt would certainly drop below 1%.
However, in economics, any regulation to control economic activities must be done with optimization, weighing the pros and cons to find a balance. It should not be forgotten that lending to consumers generates economic activity that contributes to GDP. Overly strict credit controls could unnecessarily reduce GDP. A clear example is the Australian Prudential Regulation Authority's requirement for a 2% buffer to remain in place even during the most stagnant economic conditions. Such behavior could be considered irrational.
Bibliography
Afrina Arfa, “Drowning in Debt: Malaysia’s Household Debt Crisis,” Taylor’s University, 06 June 2024.
Thansin Klinthanom, “Thai Household Debt and Risks to the Economy,” Krungsri Research, 17 May 2024.
“Household Debt Rose by $184 Billion in Q1 2024; Delinquency Transition Rates Increased Across All Debt Types,” Federal Reserve Bank of New York Center for Microeconomic Data, 2023: Q4 (Released February 2024).
Lawrence Wong, Deputy Prime Minister and Minister for Finance, “Written Reply to Parliamentary Question on Household and Individual Debt Trends and Management,” Monetary Authority of Singapore, 22 November 2023.
June 2024.
EC_MB_040 “Loans to Households by Purpose,” Bank of Thailand.
“Household Debt: What the Data Show,” Reserve Bank of Australia Bulletin, March 2003.