Housing Price Index for New Developments in Bangkok and Surrounding Areas – Q1 2024
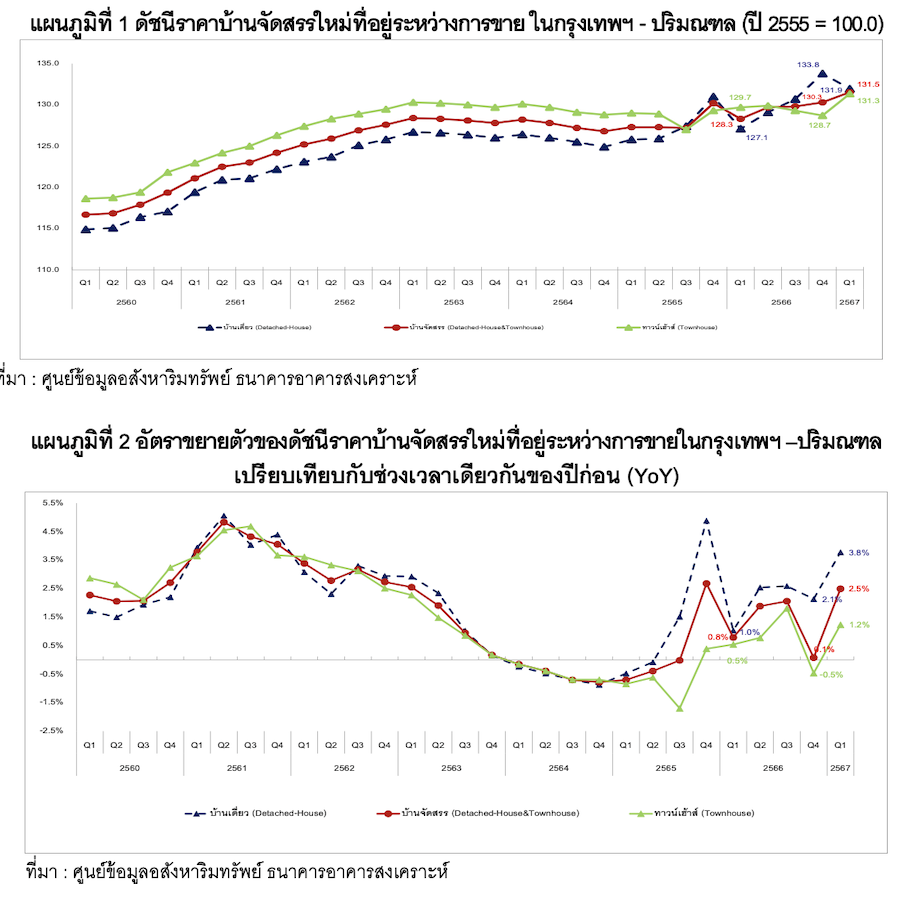
The index for new housing developments currently for sale in Bangkok and its vicinity for Q1 2024 continues to rise for the fifth consecutive quarter, increasing by 2.5% with the index value at 131.5 points. This reflects a continuous upward trend in housing prices, primarily driven by rising costs of land, construction materials, and labor. Only certain locations have managed to maintain prices due to original cost factors. It is expected that the prices of new housing projects will reflect these new costs, pushing the housing price index to trend higher in the second half of the year.
New Housing Price Index for Sale in Bangkok and Surrounding Areas (Single-family Homes and Townhouses)
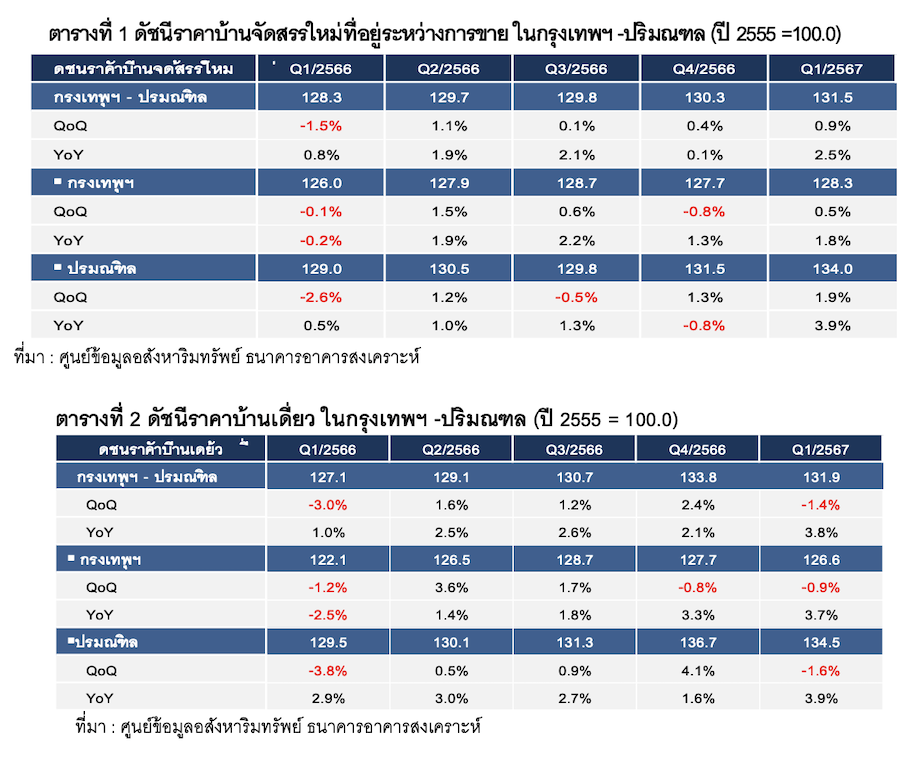
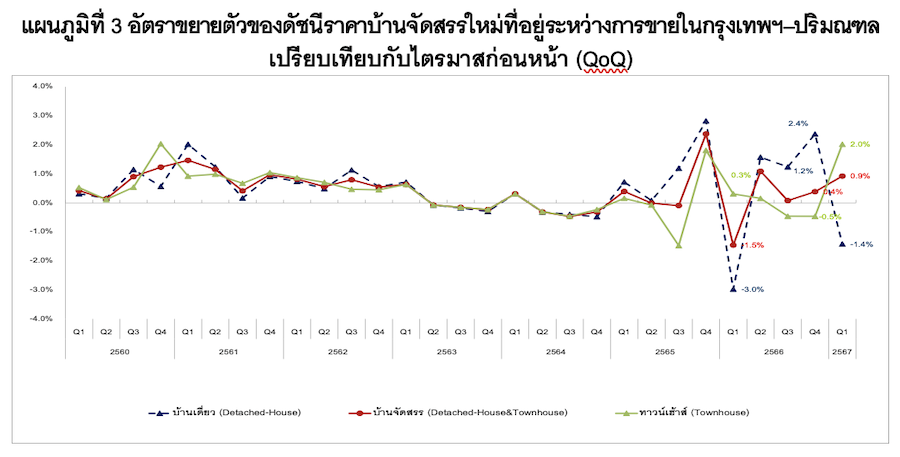
The Real Estate Information Center of the Government Housing Bank, or REIC, reports that the index for new housing developments currently for sale in Bangkok and its vicinity for Q1 2024 stands at 131.5, an increase of 2.5% compared to the same period last year (YoY) when the index was 128.3. This marks a continuous increase over 5 quarters from Q1 2023 to Q1 2024. Compared to Q4 2023 (QoQ), the index has risen by 0.9%, indicating that housing prices in Q1 2024 have consistently increased compared to the same period last year (YoY) and the previous quarter (QoQ).
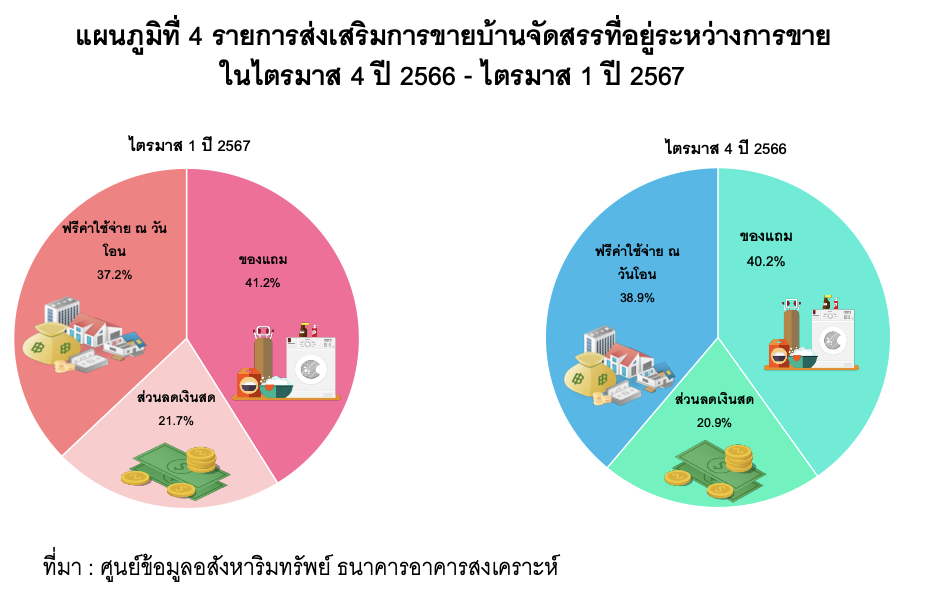
Dr. Vichai Wiratthakhan, the bank inspector and acting director of the Real Estate Information Center, revealed that the main reason for the continuous increase in the new housing price index is due to rising development costs influenced by various factors, such as land prices, construction material costs, and labor costs. This has resulted in higher selling prices for housing developments launched in 2022-2023. Meanwhile, the purchasing power for housing faces limitations in several aspects. To stimulate sales, it was found that in this quarter, most developers employed promotional strategies to boost sales, offering gifts up to 41.2%, followed by assistance with transfer fees at 37.2% to ease the burden on buyers.
When categorizing the housing price index by area, it was found that in Bangkok, the index stands at 128.3, an increase of 1.8% compared to the same period last year (YoY) and an increase of 0.5% compared to the previous quarter (QoQ). Meanwhile, the 3 surrounding provinces (Nonthaburi, Pathum Thani, and Samut Prakan) have an index value of 134.0, which is an increase of 3.9% compared to the same period last year (YoY) and an increase of 1.9% compared to the previous quarter (QoQ). The rate of change in housing prices in Bangkok has increased less than in the 3 surrounding provinces (see Tables 1 and Charts 1-3).
As for the index for single-family homes in Bangkok and its vicinity, the index for Q1 2024 is 131.9, an increase of 3.8% compared to the same period last year (YoY), marking a continuous increase over 7 quarters from Q3 2022 to Q1 2024. However, it has decreased by -1.4% compared to the previous quarter (QoQ).
When considering by area, Bangkok has an index value of 126.6, which is an increase of 3.7% compared to the same period last year (YoY) but decreased by -0.9% compared to the previous quarter (QoQ). This decrease is attributed to promotional activities aimed at stimulating sales of single-family homes in Q1 2024, where most of the discounted single-family homes are high-priced homes above 10 million baht. This is to stimulate the market to clear stock and reduce prices from the previous quarter, particularly in the areas of Rat Burana, Bang Khun Thian, Thung Khru, Bang Bon, and Chom Thong, followed by the areas of Lat Phrao, Bang Kapi, Wang Thonglang, Bueng Kum, Saphan Sung, Khan Na Yao, and Bang Khen, Sai Mai, Don Mueang, and Lak Si.
For the 3 surrounding provinces (Nonthaburi, Pathum Thani, and Samut Prakan), the index stands at 134.5, an increase of 3.9% compared to the same period last year (YoY) but decreased by -1.6% compared to the previous quarter (QoQ). It was found that the price of single-family homes has increased continuously for 8 quarters from Q2 2022 to Q1 2024 (see Tables 2 and Charts 1-3), particularly for projects launched in 2022-2023 due to higher costs from increased construction material prices compared to the same period last year. The areas with the highest price increases include Bang Phli, Bang Bo, and Bang Sao Thong in the price range of 5.01 – 7.50 million baht, followed by Lam Luk Ka, Khlong Luang, Thanyaburi, and Nong Suea in the price range of 3.01 – 5.00 million baht, and the area of Pathum Thani City, Lat Lum Kaeo, and Sam Khok in the price range of over 10 million baht.
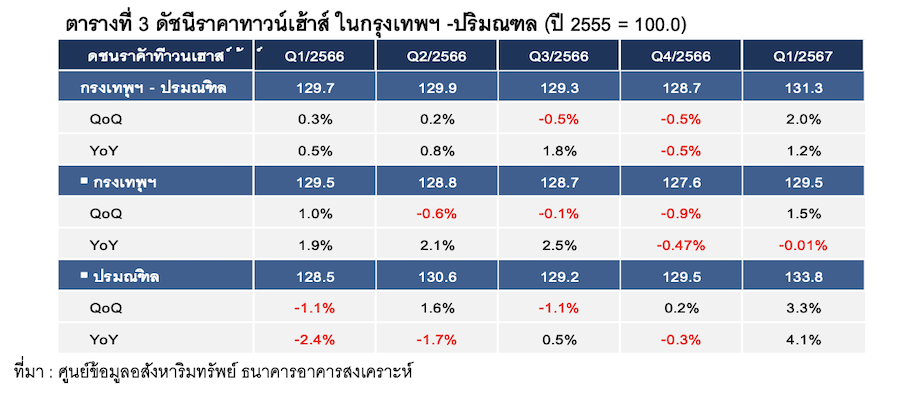
The townhouse price index in Bangkok and its vicinity for Q1 2024 stands at 131.3, an increase of 1.2% compared to the same period last year (YoY) and an increase of 2.0% compared to the previous quarter (QoQ). The price index has shown a trend of returning to increase after a decline in the previous quarter. It is noted that the increase in the price index in Q1 2024 is due to the selling prices announced for new projects. However, for older projects from 2021, the production costs remain the same, and some projects still reduce prices to stimulate the market and clear stock.
In the area of Bangkok, the townhouse price index is 129.5, decreasing by -0.01% compared to the same period last year (YoY) but increasing by 1.5% compared to the previous quarter (QoQ). This increase in the price index follows a continuous decline over 3 quarters from Q2 2022 to Q4 2022, primarily for older projects from 2021, where production costs remain unchanged. To stimulate the market and clear stock, the most significant price reductions were found in the areas of Min Buri, Nong Chok, Khlong Sam Wa, and Lat Krabang in the price range of 2.01 – 3.00 million baht, followed by Phra Khanong, Bang Na, Suan Luang, and Prawet in the price range of 3.01 – 5.00 million baht, and Rat Burana, Bang Khun Thian, Thung Khru, Bang Bon, and Chom Thong in the price range of 2.01 – 3.00 million baht.
Meanwhile, in the 3 surrounding provinces (Nonthaburi, Pathum Thani, and Samut Prakan), the townhouse price index stands at 133.8, increasing by 4.1% compared to the same period last year after a decline in the previous quarter, and increasing by 3.3% compared to the previous quarter (QoQ). It was found that the most significant price increases occurred in the areas of Bang Phli, Bang Bo, and Bang Sao Thong in the price range of 2.01 – 3.00 million baht, followed by Lam Luk Ka, Khlong Luang, Thanyaburi, and Nong Suea in the price range of 2.01 – 3.00 million baht, and the area of Samut Prakan City, Phra Samut Chedi, and Phra Pradaeng in the price range of 2.01 – 3.00 million baht compared to the same period last year (see Tables 3 and Charts 1-3).
“Amidst a still sluggish economy, developers have increasingly employed promotional strategies, such as cash discounts, gifts, and assistance with transfer fees, to stimulate sales. However, with the government's announcement of economic stimulus measures through the purchase of housing priced at no more than 7 million baht, it is expected to significantly increase demand or market demand for housing, especially in the second half of 2024. This is anticipated to help clear existing supply that remains at original cost prices. When developers launch new projects, the prices of new housing will reflect these new costs, which will push the housing price index to trend higher. This means that those looking to buy housing will have to purchase at higher prices. Therefore, the key to helping Thai people afford housing in a rising price environment is to improve the economy, create income distribution that reaches all groups of people, which will help improve the income of Thai citizens and enhance their ability to purchase housing and access credit,” Dr. Vichai concluded.
Methodology for Data Compilation
The new housing price index currently for sale consists of the index for single-family homes and the index for townhouses in new housing developments still on the market. Projects currently for sale refer to those with at least 6 units available. In compiling this price index, second-hand homes are not included.
The data collection area includes Bangkok and its vicinity, comprising Bangkok, Nonthaburi, Pathum Thani, and Samut Prakan, which are only 4 provinces. The sampling method for this price index will use purposive sampling with a total of 245 samples. The selling prices used to compile this price index are actual selling prices, excluding promotional item values from the listed prices, using the year 2012 as the base year.