
2 Million Thai Households Vulnerable Due to Heavy Debt, Risking Over a Decade to Recover
Over the past decade, the financial vulnerability of households has increasingly become a significant economic issue in Thailand. This is due to the rapid and continuous accumulation of debt among Thai households, while income has not grown at the same rate, leading to financial imbalance. The ratio of household debt to GDP in Thailand rose from 52.4% in 2008 to 90.1% by the end of 2021. Compared to other countries, Thailand shows a rapid growth trend in debt relative to income, particularly during the period from 2008 to 2014 and after the COVID-19 crisis. As a result, Thailand's debt-to-GDP ratio is significantly higher than the average of developed countries, even though Thailand's income per capita is much lower (Figure 1). Currently, the household debt-to-GDP ratio in Thailand for the first half of this year stands at 88.2%. The EIC estimates that this ratio will gradually decrease, expected to be around 86-87% of GDP by the end of 2022, which still represents the highest level compared to developing countries with similar income levels.
Figure 1: Household Debt to GDP Ratio in Thailand Compared to Other Countries
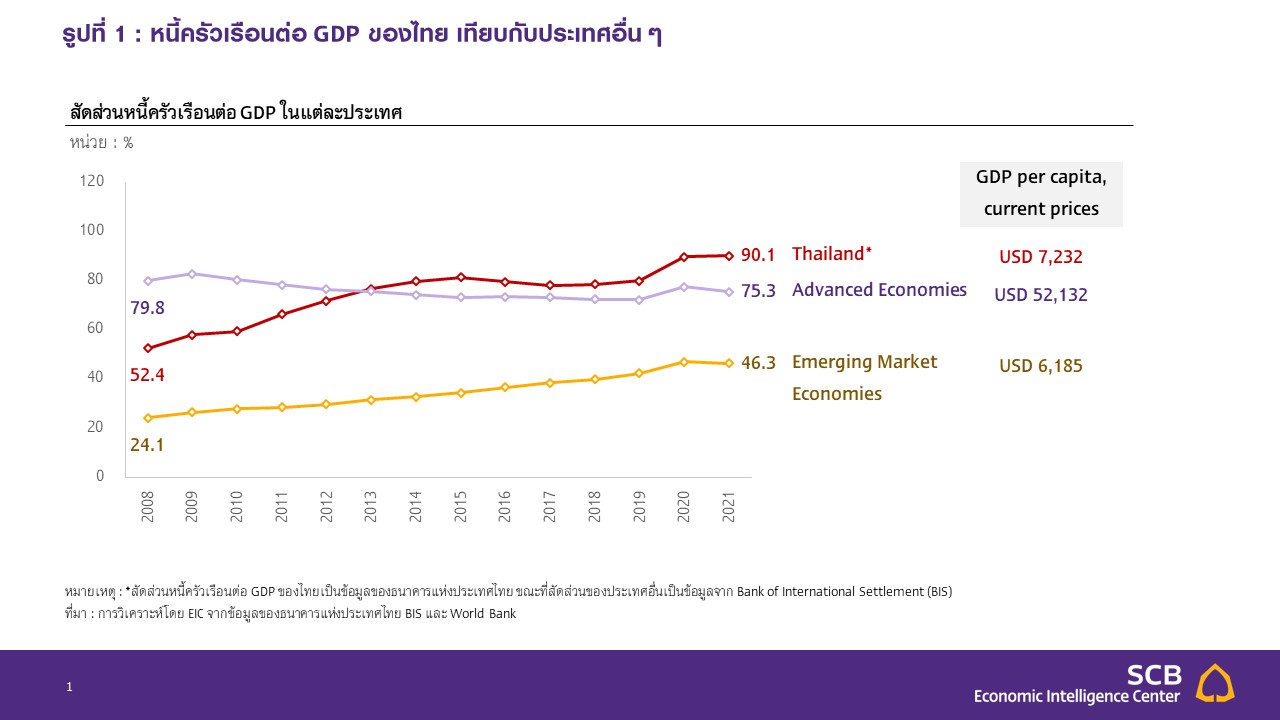
Note: *The household debt-to-GDP ratio for Thailand is data from the Bank of Thailand, while the ratios for other countries are from the Bank of International Settlement (BIS).
Source: Analysis by EIC based on data from the Bank of Thailand, BIS, and World Bank.
While it can be said that Thailand has a high household debt problem compared to many countries, there is no clear definition for identifying which households are considered financially vulnerable (Financial vulnerability). In this study, the EIC employed machine learning methods to identify and classify "vulnerable households" based on methodologies used in other countries and analyzed the likelihood of spending problems in this group of households, as well as assessing the duration and obstacles to recovery, to inform solutions and prevention of vulnerability.
Classifying Thai Households by Vulnerability Using Machine Learning
In the clustering of households, the EIC referenced the method from Azzopardi, D., et al. (2019)[1], which used machine learning to cluster households in the U.S. based on financial vulnerability conditions, applying it to Thai data from the National Statistical Office's household economic and social survey, using data from 2013-2021[2].
The clustering process consists of two steps: Step 1 involves determining the appropriate number of clusters using the Elbow method[3], and Step 2 involves clustering according to the number found in the previous step using K-means Clustering, with the latest data from 2021 as the base year for clustering.
The criteria for vulnerability used in the clustering include four conditions: (1) income, (2) debt-to-asset ratio (Leverage ratio), (3) debt service burden relative to income (Debt-Service Ratio: DSR), and (4) debt-to-annual income ratio. The first three criteria were used in Azzopardi, D., et al. (2019), while the fourth criterion was added in this study to improve the clustering of Thai households, as asset data may have valuation discrepancies in some cases due to self-assessment (data from surveys). Another important reason is that during 2020-21, financial institutions provided debt moratoriums to assist some borrowers during the COVID crisis, which may have temporarily lowered DSR, not accurately reflecting the true debt problem.
In considering these criteria, maximum values for the debt-to-asset ratio and DSR were set at 200%, and the debt-to-income ratio was capped at five times annual income to eliminate outlier data that could skew clustering results using K-means. The results of clustering based on the above methods and criteria can classify Thai households in 2021 into a total of six groups[4], with the basic statistics of the sample households shown in Table 1.
Table 1: Basic Statistics of Sample Household Data in 2021 Based on Clustering Using Elbow Method and K-Means
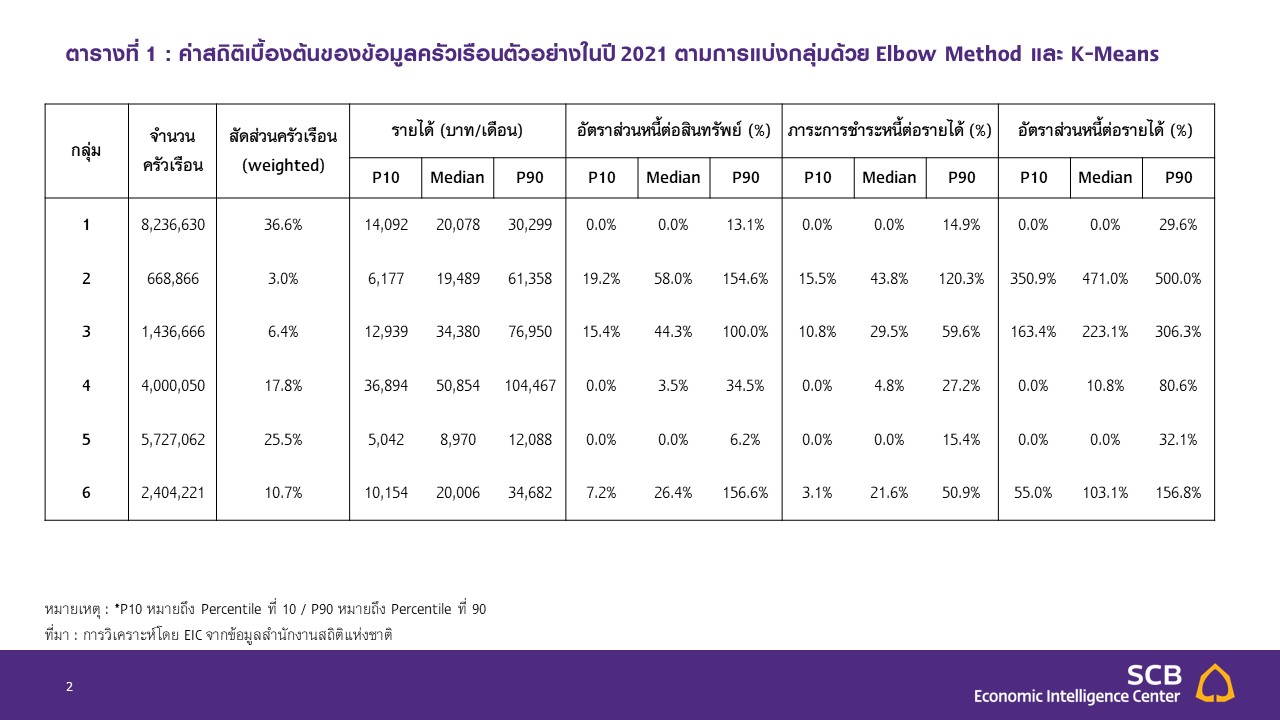
Note: *P10 refers to the 10th percentile / P90 refers to the 90th percentile. Source: Analysis by EIC based on data from the National Statistical Office.
The economic characteristics of each household group are as follows:
- Group 1: Middle-income households (median income of 20,000 THB per month) with little or no debt. This group accounts for 36.6% of all households.
- Group 2: Middle-income households (median income of 19,000 THB per month) with very high debt levels relative to both income and assets. This group accounts for 3.0% of all households.
- Group 3: Similar to Group 2, these households have high debt levels relative to both income and assets, but their income is above average (median income of 34,000 THB per month). This group accounts for 6.4% of all households.
- Group 4: High-income households (median income of 51,000 THB per month) with low debt levels. This group accounts for 17.8% of all households.
- Group 5: Low-income households (median income of 8,900 THB per month) accounting for 25.5% of all households, with little or no debt, which may reflect limited access to credit sources for some households.
- Group 6: Middle-income households (median income of 20,000 THB per month) with average debt levels among indebted households. This group accounts for 10.7% of all households.
From the characteristics of the six household groups identified by machine learning, the EIC analyzes that Groups 2 and 3 are considered vulnerable households. Despite having above-average income, both groups exhibit significantly more severe debt problems than other groups. The median income of vulnerable households is 30,000 THB per month, which is 58.3% higher than the median income of Thai households in 2021 at 19,000 THB. However, these households are vulnerable due to their high debt levels relative to income and assets, with debt-to-income ratios for Groups 2 and 3 reaching 4.7 and 2.2 times annual income, respectively, which is more than double that of other groups (the average debt-to-income ratio for indebted Thai households in 2021 was 1.1 times). Similarly, their debt-to-asset ratios are also significantly higher than those of other groups. Additionally, their debt service ratios (DSR) are higher than those of other groups. Although the median DSR for Group 6 at 21.6% is similar to that of Group 3, it is still considered manageable. Furthermore, the debt-to-income and debt-to-asset ratios for Group 6 are half those of Groups 2 and 3, indicating that Group 6 does not share the same level of vulnerability.
For Group 5, which comprises about one-fourth of households, while not classified as vulnerable due to lack of debt burden, it is considered economically weak. This group not only has low income but also has a high dependency on income from others, facing challenges in accessing credit sources. Over half of the households in this group rely on income from unemployment benefits, government assistance, or support from others, partly due to 24.6% of this group being elderly households[5], who may have limited ability to generate income themselves. Additionally, this group tends to have limited access to funding sources, with 28.1% of households wishing to borrow for emergencies unable to do so or only receiving partial amounts, making it difficult to address liquidity issues during economic crises. Other groups (1, 4, and 6) are classified as having normal financial status due to their moderate to high income and manageable debt levels.
Characteristics of Vulnerable Thai Households
Vulnerable households in Thailand exhibit distinct economic and social characteristics compared to other household groups in terms of income. Vulnerable households have higher incomes than the average Thai household, with 61.4% of vulnerable households falling into the middle to high-income group, averaging around 30,000-60,000 THB per month (Figure 2). In terms of income sources, vulnerable households have a higher proportion of income derived from business and agriculture, which typically have higher income uncertainty compared to households whose primary income comes from salaries or government jobs. This presents an additional challenge in managing debt. Geographically, vulnerable households are more concentrated in the northern and northeastern regions. In terms of household structure, vulnerable households have an average of 3.2 members, compared to 2.7 members in non-vulnerable households.
Figure 2: Proportion of Vulnerable Households by Income and Household Characteristics in 2021
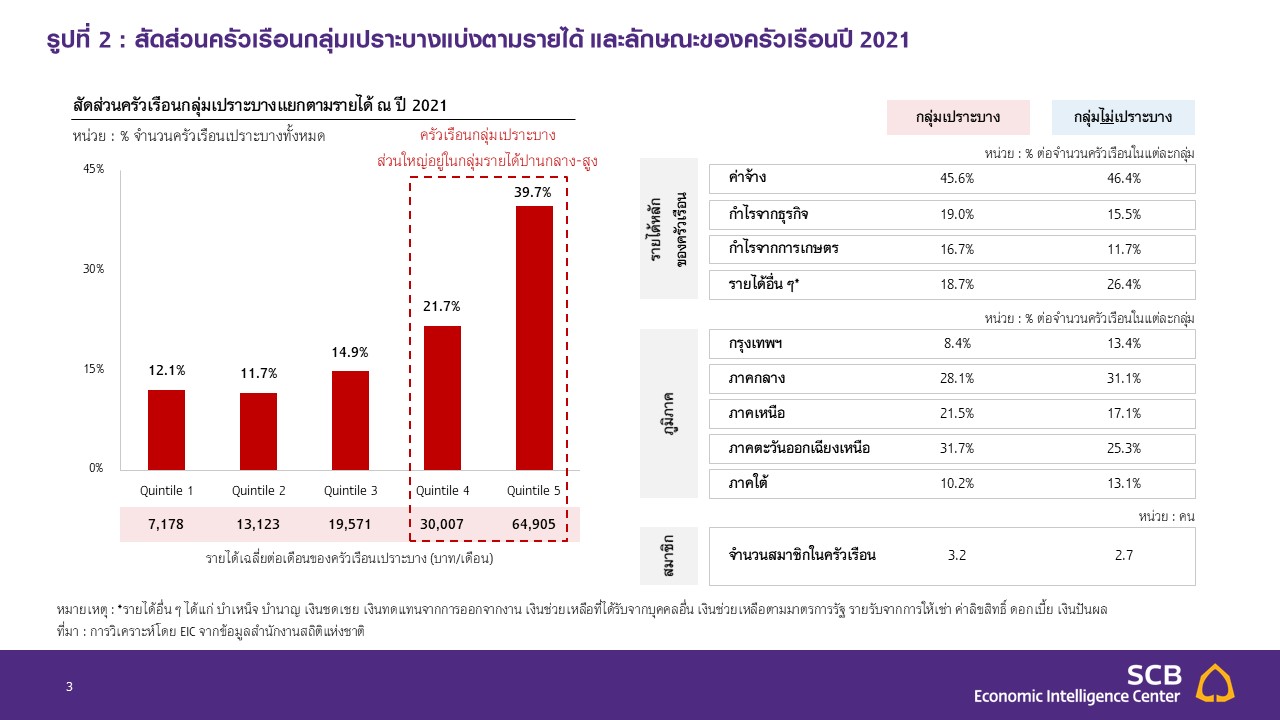
Note: *Other income includes pensions, unemployment compensation, assistance from others, government aid, rental income, royalties, interest, and dividends.
Source: Analysis by EIC based on data from the National Statistical Office.
Vulnerable households have at least a 30% chance of experiencing income shortfalls compared to other groups. The EIC analyzed trends in income shortfalls, a critical indicator of household quality of life, using regression equations from household data from 2013-21 across three models (Figure 3). It was found that being in a vulnerable group significantly increases the likelihood of experiencing income shortfalls by no less than 30% in all models, making it a highly impactful variable compared to other important economic and household characteristics. The main reason is that vulnerable groups have high debt levels relative to income, leading to high debt repayment expenses. This variable may also reflect a lack of financial discipline that contributes to both vulnerability and income shortfall issues.
For the important economic variable of income, it also shows significant results, with a 1% increase in income leading to a 0.16-0.18% decrease in the likelihood of income shortfalls. Additionally, when considering liquidity factors in Model 2 by including the "financial buffer" variable (calculated from the ratio of financial assets to household expenses), it was found that this variable is significant in explaining spending problem trends as well. A 1% increase in this ratio results in a 0.025-0.026% decrease in the likelihood of problems arising, indicating that greater financial liquidity relative to expense levels reduces the chances of income shortfalls.
In Model 3, additional variables were considered to assess factors related to spending and living costs, including the ratio of discretionary spending[6] and living in urban areas and Bangkok, with the hypothesis that discretionary spending may contribute to spending problems, and living in urban areas or Bangkok, where the cost of living is high, may also have some effect. The results from the regression in Model 3 align with the hypothesis significantly, with a 1% increase in the ratio of discretionary spending to total expenses leading to a 0.15% increase in the likelihood of spending problems. Additionally, living in urban areas and Bangkok significantly increases the likelihood of problems by 1.15% and 4.43%, respectively.
Household characteristics also affect the likelihood of spending problems to varying degrees, with factors that increase the likelihood of problems including having income sources that fluctuate due to not having salaried workers in the household or having workers in agriculture, and a high dependency ratio (the number of non-working individuals, such as children and the elderly, compared to working individuals in the same household). All three factors are significant in explaining the likelihood of spending problems.
Figure 3: Factors Affecting the Likelihood of Income Shortfalls
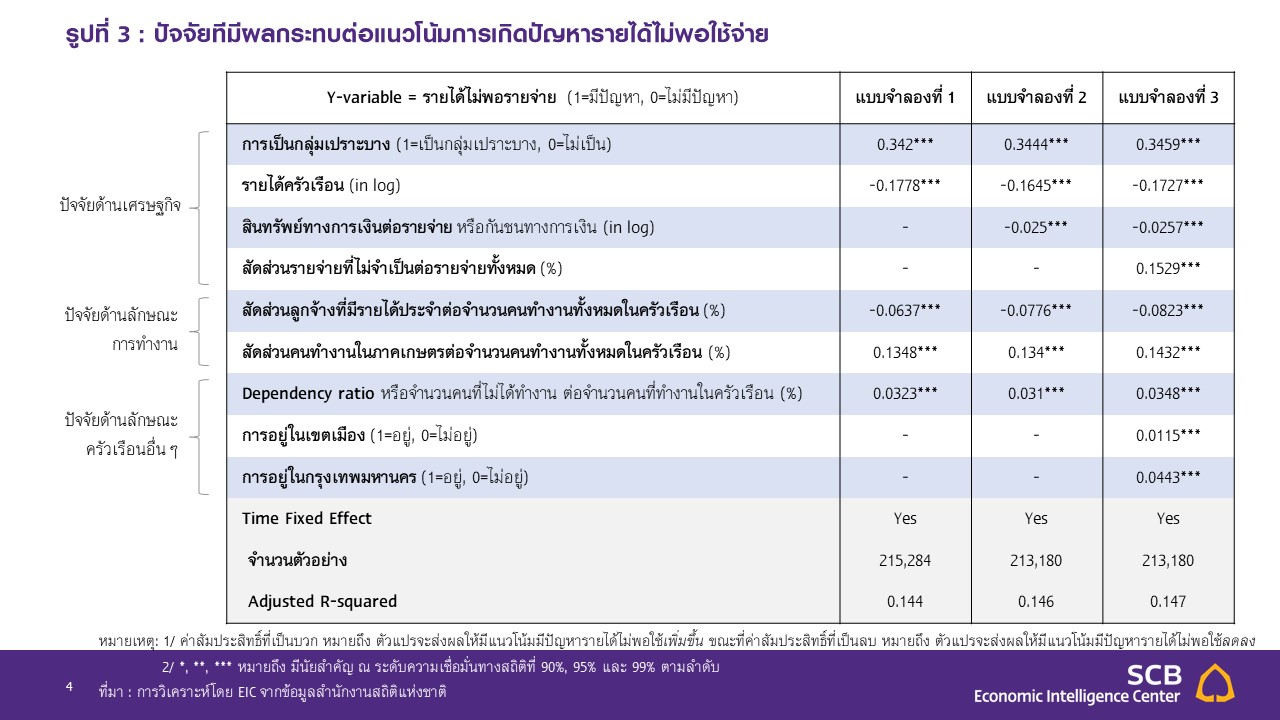
Note: 1/ Positive coefficients indicate that the variable increases the likelihood of income shortfalls, while negative coefficients indicate that the variable decreases the likelihood of income shortfalls.
2/ *, **, *** indicate significance at the 90%, 95%, and 99% confidence levels, respectively.
Source: Analysis by EIC based on data from the National Statistical Office.
Vulnerability of Thai Households Over the Past 8 Years
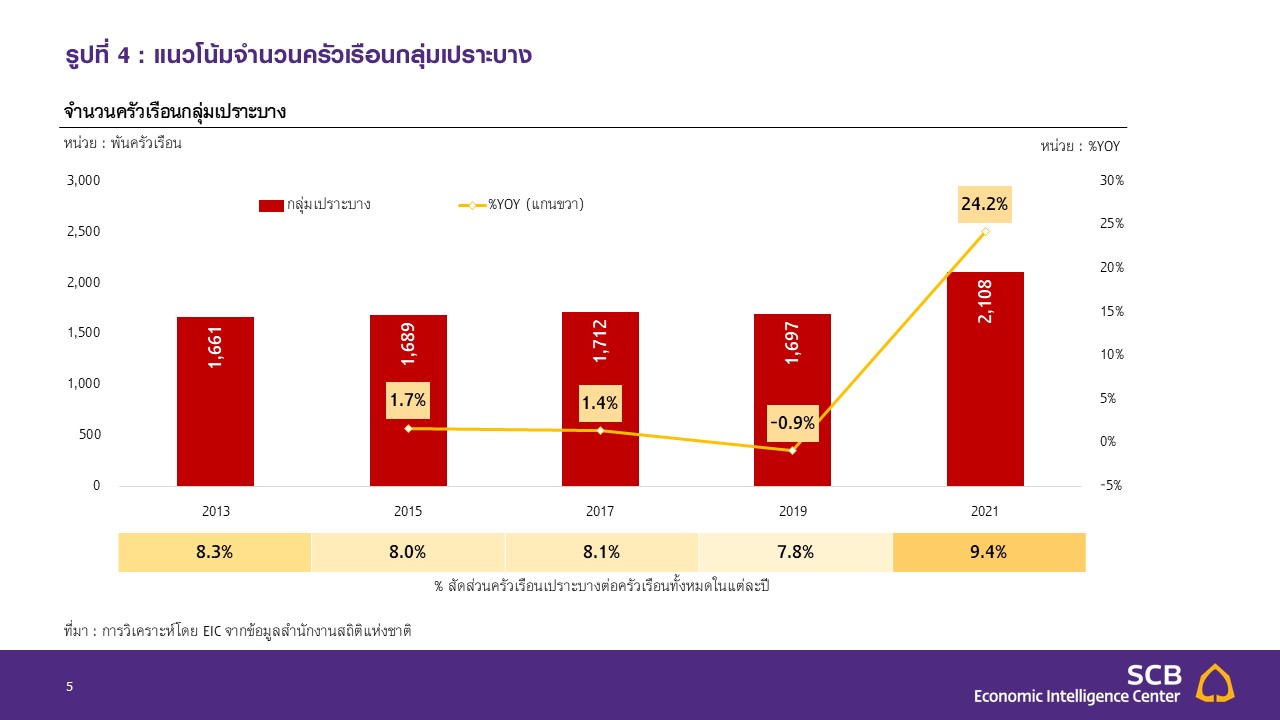
The number and proportion of "vulnerable households" in Thailand have significantly increased following the COVID-19 crisis. Vulnerable households identified through machine learning have shown stable numbers and proportions from 2013 to 2019. However, in 2021, after the COVID crisis, the number of vulnerable households rose to 2.1 million from 1.7 million, representing a 24.2% increase from 2019, raising the proportion to 9.4% from 7.8% of all households in 2019 (Figure 4).
Figure 4: Trend in the Number of Vulnerable Households
Source: Analysis by EIC based on data from the National Statistical Office.
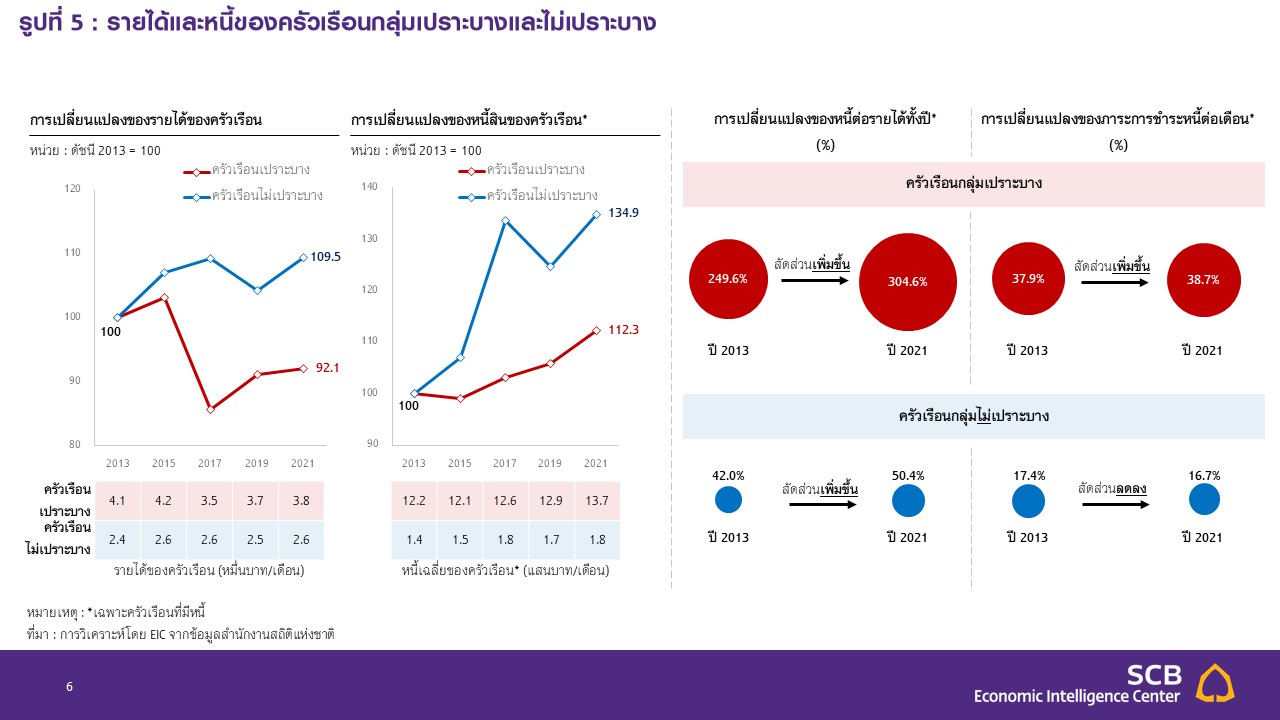
In addition to the increase in numbers, vulnerable groups have also shown a downward trend in income, contrasting with the rising income of non-vulnerable groups. In 2021, income decreased by -7.9% compared to 2013 levels, while income for non-vulnerable groups increased by 9.5% during the same period. This has resulted in a higher debt-to-income ratio for vulnerable groups, increasing at a rate greater than that of non-vulnerable groups during this time, despite the value of debt for vulnerable groups not increasing significantly (Figure 5). The slower increase in debt for vulnerable groups is likely due to their already high existing debt levels, making it more difficult to obtain new loans, especially from formal sources, unlike non-vulnerable groups who have less debt and can borrow more easily. Furthermore, the decrease in income has led to an increase in monthly debt repayment burdens for vulnerable groups over the past eight years, while non-vulnerable groups have seen a slight decrease.
Figure 5: Income and Debt of Vulnerable and Non-Vulnerable Households
Note: *For households with debt only.
Source: Analysis by EIC based on data from the National Statistical Office.
Future Trends
Addressing vulnerability issues takes time. Vulnerable households face challenges due to high debt levels relative to income or assets, making it difficult to reduce debt and escape vulnerability in a short time. Continuous income alongside disciplined debt repayment is necessary, which is likely to take a long time. The EIC estimates that it may take an average of about 13 years for households to escape vulnerability, assuming they maintain their current debt repayment capacity and continue into the future to reduce debt to manageable levels[7].
However, a concerning aspect of the overall financial vulnerability situation of Thai households is that not all vulnerable households will be able to easily resolve their issues due to several significant limitations, including (1) lack of savings, which is an issue for approximately 61.2% of vulnerable households. These individuals have no money left to pay off existing debts or may need to incur new debts to pay off old ones, risking further problems that could ultimately lead to bad debt. (2) Aging households: About 15.1% of vulnerable households have working members nearing retirement age, limiting the time available to earn income to reduce vulnerability. They may need to work beyond retirement age to restore their financial status to normal. (3) Limited access to formal funding sources poses another challenge for many households, leading some to rely on informal loans with high interest rates, which increases their debt repayment burden and is a significant cause of vulnerability in many households.
The current cost of living and rising interest rates are likely to make addressing vulnerability issues more difficult and time-consuming. The acceleration of living costs due to global inflation and the trend of rising interest rates to curb inflation directly impacts the financial vulnerability of households, with effects manifesting in three areas: (1) Increased expenses reduce the amount of money available for debt repayment. The EIC's analysis, based on the latest economic projections, indicates that the current cost of living situation has caused the savings rate of Thai households to drop from 15.6% to 10.0%, with the number of households experiencing income shortfalls increasing from 7.1 to 8.4 million households, resulting in an overall decrease in the money available for debt repayment. (2) Increased expenses may lead some households to borrow more. Households experiencing income shortfalls are likely to borrow to cover the shortfall. A consumer survey conducted by the EIC from July 8-22, 2022, found that 23.7% of respondents chose to cope with rising living costs by borrowing. Overall, the EIC estimates that household debt in 2022 will increase by about 3-4% from 2021, with liquidity-related debt expected to grow faster than the average. Additionally, the study found that in this accelerating inflation scenario, about 160,000 households with normal status will see their debt levels rise significantly, turning them into vulnerable households. This group typically has low savings rates and limited liquidity reserves, coupled with a high proportion of energy and food consumption relative to income. (3) Rising interest rates increase debt repayment burdens or slow down the reduction of debt due to higher interest payments, resulting in less principal repayment under the same installment value. The EIC expects that Thailand's policy interest rate will gradually rise from the current 1.0% to 2.0% during 2023.
Conclusions and Implications
This study finds that the proportion of Thai households vulnerable due to debt issues currently stands at 9.4% of all households. Although this may not seem like a high number, if we consider only Thai households with debt (51.5% of all households), it indicates that nearly one in five indebted households is vulnerable due to heavy debt, and this proportion has significantly increased from previous periods. Moreover, it is unlikely to decrease easily in a short time. Additionally, the issues of living costs and rising interest rates are likely to exacerbate vulnerability further. These findings indicate four important implications for the economy:
(1) The risk of bad debt from consumer loans remains concerning. Although the current non-performing loan (NPL) ratio for consumer debt in commercial banks is not high, partly due to assistance measures from financial institutions, one in five borrowers remains vulnerable. Reducing assistance levels and raising interest rates in the near future may impact this group, so it should be done gradually, in line with the readiness of borrowers who are still quite vulnerable and need time to adjust.
(2) The challenge in addressing this issue lies in household limitations, including liquidity shortages, vulnerability in aging households, and lack of access to formal loan sources. This requires special assistance in various areas, such as long-term low-interest liquidity support measures, restructuring debt to match repayment capabilities, promoting employment and welfare for elderly individuals still needing income. Additionally, using alternative data (such as transaction records, phone usage, utility payment records, etc.) alongside technology for loan approval assessments instead of traditional financial data like pay slips and bank statements can help vulnerable groups, many of whom do not have regular income, access loans from formal sources more easily, reducing the problem of lacking funding in emergencies and high-interest informal debt.
(3) Preventing households from becoming vulnerable is crucial, as once they become vulnerable, it takes a long time to resolve and they risk encountering additional problems. Therefore, for this issue, prevention is less costly than remediation and can be achieved through various methods, such as accumulating reserve funds for liquidity in emergencies to guard against income loss or sudden expense increases, possibly alongside life, health, or property insurance to protect against unforeseen events that could lead to significant expenses in a short time. Additionally, financial discipline is essential, especially regarding debt that should be proportionate to one's repayment capacity, avoiding excessive consumer debt, or negotiating to restructure existing debt to manageable levels. According to statistical criteria, the debt burden to be repaid each month should not exceed 30% of average income.
(4) In addition to the vulnerability from high debt, one in four Thai households also faces low income, which, while not classified as vulnerable due to debt issues, is sensitive to economic impact factors, especially living costs, and risks falling into the vulnerable category. Thus, this group also requires assistance and enhancement of financial capacity in terms of income generation and financial discipline.
Analysis by... https://www.scbeic.com/th/detail/product/household-debt-041122
[1] Azzopardi, D., et al. (2019), "Assessing Household Financial Vulnerability: Empirical evidence from the U.S. using machine learning", in OECD Economic Survey of the United States: Key Research Findings, OECD Publishing, Paris, https://doi.org/10.1787/75c63aa1-en.
[2] The National Statistical Office conducts surveys every two years, with financial data suitable for analysis using this method starting from 2013.
[3] The Elbow Method is a technique used to determine the appropriate number of clusters, which is the number of groups in data sets that minimizes the distance from each data point to the nearest centroid while maximizing the distance between centroids. The EIC chose this method as it yielded more suitable results compared to the HAC method used in Azzopardi, D., et al. (2019) for Thai data.
[4] The criteria for clustering households for 2021 will be used as the basis for clustering households in 2013-19 according to the study approach of Azzopardi, D., et al. (2019) to observe trends in the changes in the number and proportion of each group over the years.
[5] Household members who are income earners are over 55 years old.
[6] Includes discretionary spending on luxury goods, alcoholic beverages, travel services, recreation, donations, lottery expenses, etc.
[7] Calculated by assuming that vulnerable households at the median are sample households, which have a debt repayment rate of about one-third of monthly expenses, allowing this sample household to repay debt continuously at an average interest rate of 5% per year on a reducing balance basis to reduce the debt-to-income ratio from 2.7 times income to no more than about 90% of income (the ratio that can convert vulnerable households into non-vulnerable ones).