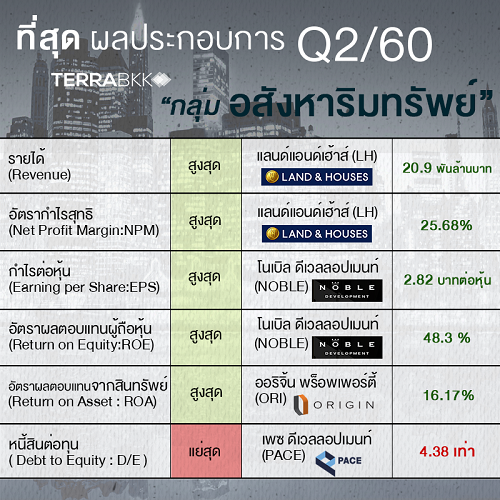
"Real Estate Group" Q2/2017 Performance
In Q2/2017, Land and Houses (LH) performed strongly, generating revenue of 20.9 billion baht with a net profit margin of 25.68%, the highest in the group. Following closely was Noble Development (NOBLE), which achieved earnings per share (EPS) of 2.82 baht and a return on equity (ROE) of 48.3%, also the highest in the group. For return on assets (ROA), the top performer was Origin Property (ORI) at 16.17%. Meanwhile, Pace Development (PACE) appears to have issues with its capital structure, as its debt-to-equity (D/E) ratio stands at 4.38 times, unusually high for the group. This summarizes the performance of the first half of the year, and we will need to monitor the second half closely. If any company continues to underperform, it may struggle to attract Thai investors.
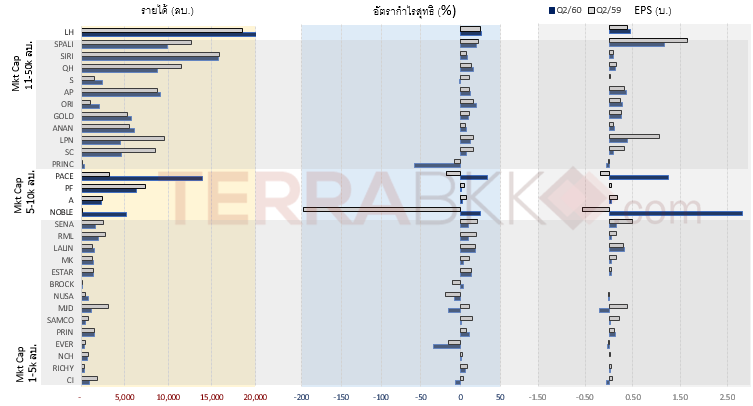
TerraBKK Research summarizes the figures for Q2 2017 in the "Real Estate Development" sector, comprising 30 companies. This includes revenue, profitability metrics such as net profit margin, earnings per share, return on equity, return on assets, and debt levels such as debt-to-equity ratio. Additionally, we assess the valuation through the P/E ratio, detailed as follows (excluding Pace Development (PACE) which has news, and Pruksa Holding (PSH) which lacks Q2 2016 data for comparison).
Revenue ()
• The average revenue for Q2 2017 was in the billion baht range.
• The top three revenues were Land and Houses (LH) at 20.9 billion baht, Sansiri (SIRI) at 15.7 billion baht, and Supalai (SPALI) at 9.8 billion baht.
• The highest revenue growth compared to the same period last year was Noble Development (NOBLE) at approximately three times, followed by Principal Capital (PRINC) and Rock Garden (BROCK) at about double.
• The largest revenue decline compared to the same period last year was Major Development (MJD) at -60.6%, L.P.N. Development (LPN) at -53.0%, and Charn Issara Development (CI) at -46.8%.
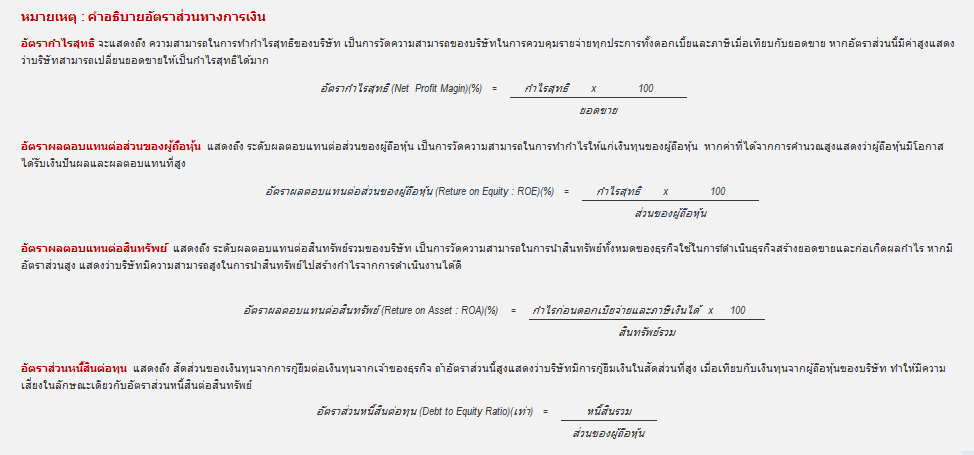
Net Profit Margin (NPM)
• The average net profit margin for Q2 2017 ranged from 1.03% to 13.7%.
• The top three net profit margins were Land and Houses (LH) at 25.68%, Noble Development (NOBLE) at 24.74%, and Supalai (SPALI) at 20.39%.
• The largest increase in net profit margin compared to the same period last year was Noble Development (NOBLE) at 24.74% (Q2/2017) from -197.5% (Q2/2016).
• The largest decrease in net profit margin compared to the same period last year was Principal Capital (PRINC) at -57.43% (Q2/2017) from -8.25% (Q2/2016).
Earnings per Share (EPS)
• The top three EPS were Noble Development (NOBLE) at 2.82 baht per share, Supalai (SPALI) at 1.17 baht per share, and Land and Houses (LH) at 0.45 baht per share.
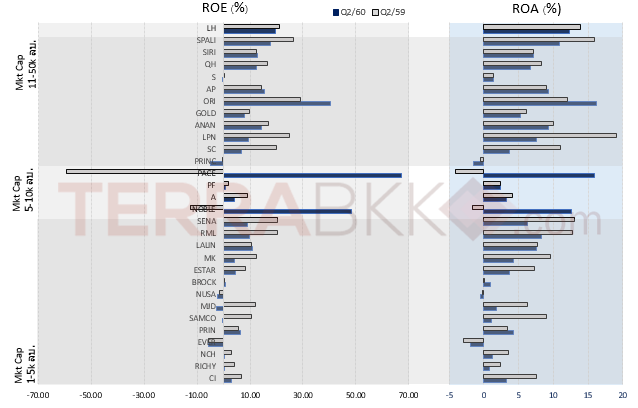
Return on Equity (ROE)
• The average ROE for Q2 2017 ranged from 0.25% to 12.56%.
• The top three ROEs were Noble Development (NOBLE) at 48.3%, Origin Property (ORI) at 40.45%, and Land and Houses (LH) at 19.63%, reflecting strong management capabilities to generate returns for shareholders.
• The largest increase in ROE compared to the same period last year was Noble Development (NOBLE) at 48.3% (Q2/2017) from -12.5% (Q2/2016).
• The largest decrease in ROE compared to the same period last year was Major Development (MJD) at -2.76% (Q2/2017) from 12.09% (Q2/2016).
Return on Assets (ROA)
• The average ROA for Q2 2017 ranged from 1.34% to 7.59%.
• The top three ROAs were Origin Property (ORI) at 16.17%, Noble Development (NOBLE) at 12.61%, and Land and Houses (LH) at 12.25%, indicating effective asset utilization.
• The largest increase in ROA compared to the same period last year was Noble Development (NOBLE) at 12.61% (Q2/2017) from -1.68% (Q2/2016).
• The largest decrease in ROA compared to the same period last year was Samakorn (SAMCO) at 1.06% (Q2/2017) from 9.07% (Q2/2016).
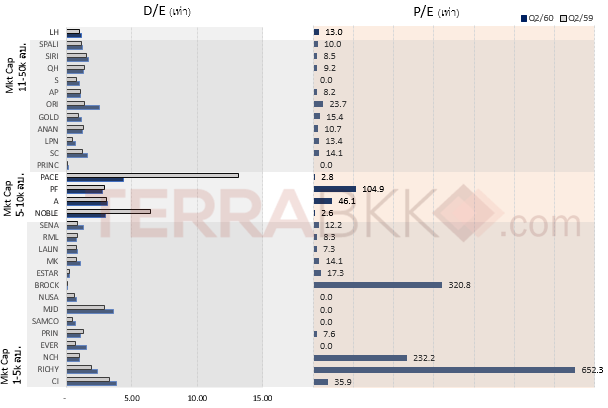
Debt to Equity (D/E)
• The average D/E for Q2 2017 ranged from 0.84 to 1.7 times.
• The top three D/E ratios were Pace Development (PACE) at 4.38 times, Charn Issara Development (CI) at 3.8 times, and Major Development (MJD) at 3.62 times, indicating poor risk management in capital structure.
P/E Ratio (as of August 18, 2017)
• The average P/E ratio for the real estate development group ranged from 7.34 to 17.25 times.
• The unusually high P/E ratios above 100 times were Richy Place 2002 (RICHY) at 652 times, Rock Garden (BROCK) at 320 times, N.C. Housing (NCH) at 234 times, and Property Perfect (PF) at 104.89 times, indicating that these stocks are significantly overpriced compared to others in the group. ---TerraBKK
 <\/strong><\/span><\/a><\/p>
 <\/strong><\/span><\/p>